The Investor Dashboard in STRATAFOLIO is designed to give investors a clear, transparent, and secure view of their investments. This feature makes it easier for commercial real estate organizations to share financial information with their partners while maintaining full control over what each investor can see. The dashboard helps investors answer common questions such as, “How are my investments performing?” and “What distributions have I received?”
There are multiple ways to get to the Investor Dashboard, depending on the investor’s role. For a Full Access Investor, the most efficient way is to navigate to the left-side navigation menu, navigate to Finances, select Investors, choose the i icon of the investor, and finally choose the Investments tab.

A Restricted Access Investor will land on the Investor Portal when they log into STRATAFOLIO. From here, they can select the Investors tab, choose the Investor’s name, and finally navigate to Investments.
What Investors See in the Dashboard
The Investor dashboard provides financial snapshots, performance metrics, and entity-level details, depending on the role assigned to the investor. Every investor must be assigned either a Full Access Investor Role or a Restricted Access Investor Role, and the role determines the data available in the dashboard.
Full Access Investor
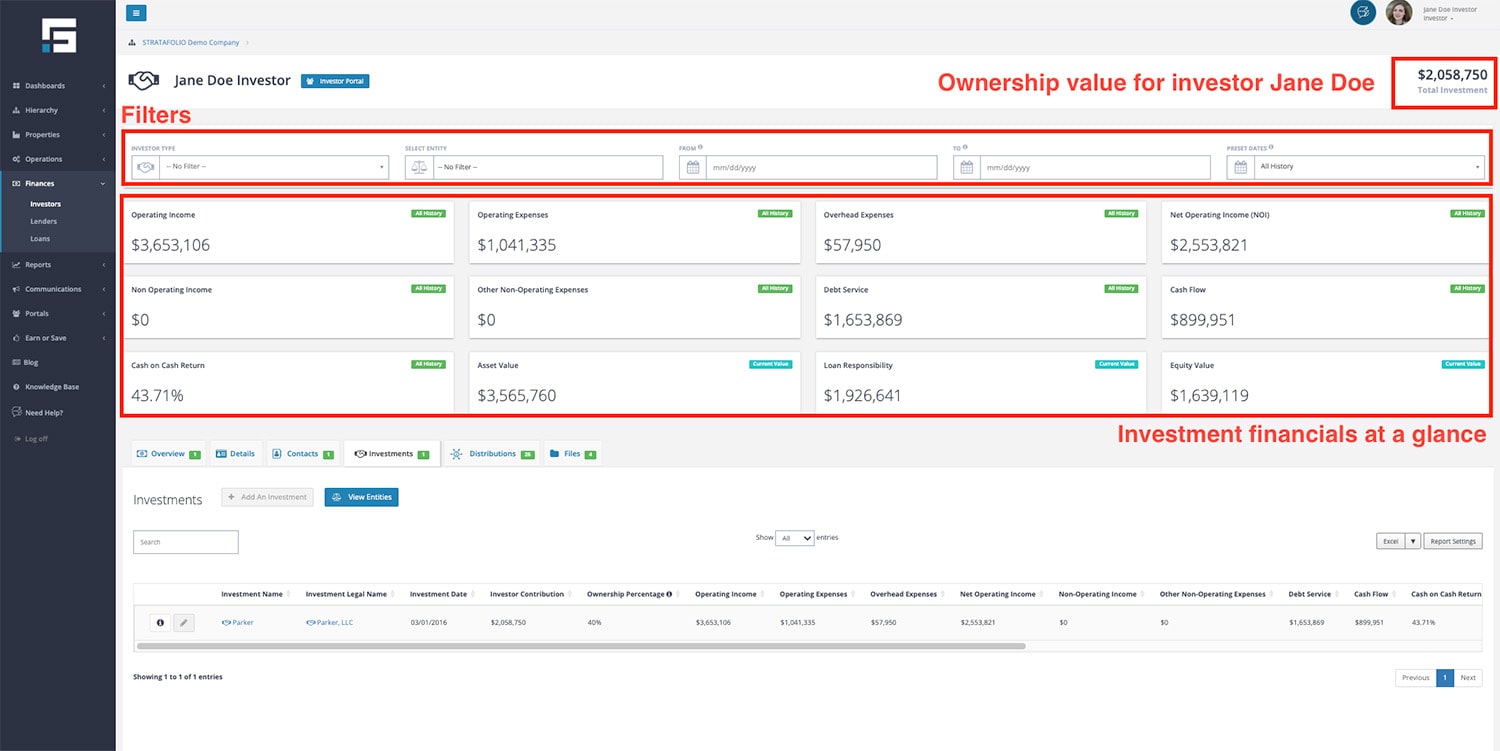
A Full Access Investor has the most complete view of their investments. From their dashboard, they can:
- Review information about all the entities they are invested in.
- See their ownership percentage in each entity.
- Track income and expenses for the entities they are tied to.
- Monitor their asset and equity values and the portion of their debt obligations (if they are a guarantor).
- Additionally, they can see contributions, distributions, and calculations (total, last, and estimated annualized calculations). They can access a graphical view of their investment performance by selecting the link for the distribution period.
- Plus, as a full-access investor, they have the ability to look at the tenant and lease information associated with their investment.
The Full Access Investor dashboard provides a detailed breakdown of performance at both the entity and organizational levels. For example, an investor may see that they hold 20% of an LLC, that the property generated $200,000 in income and $80,000 in expenses for the quarter, and that they received a $15,000 distribution.
Full Access Investors can also upload files into STRATAFOLIO. These might include agreements or supporting documentation. However, they can only edit or delete files they personally uploaded, and only if permissions are enabled. They cannot alter any organizational data.
Restricted Access Investor

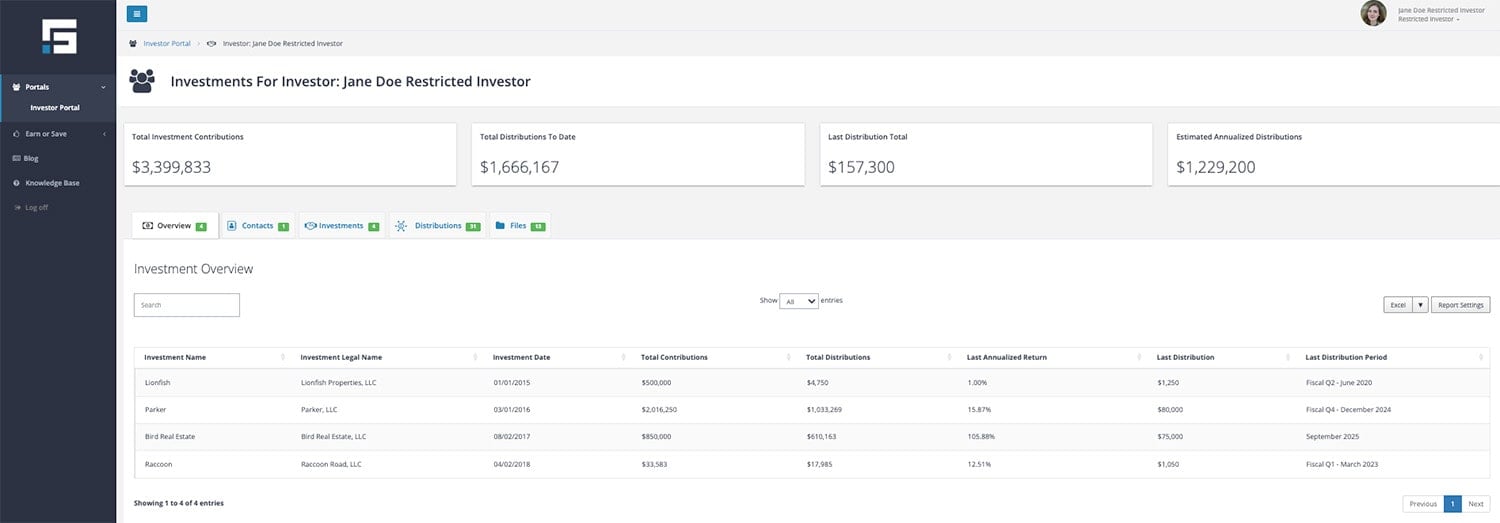
A Restricted Access Investor sees a simplified view. Their dashboard focuses on high-level summaries rather than detailed breakdowns. From this view, they can:
- See their total contributions.
- View total distributions received.
- Review their estimated annualized distributions.
- Access a summary of their distributions to date.
Restricted Access Investors also have the ability to upload files, but the same rule applies: they can only edit or delete their own uploaded files if allowed. This role does not provide entity-level data such as ownership percentages or detailed income and expense reports. Instead, it ensures investors see only the information directly related to their account.
Why the Dashboard Matters
By customizing what investors see based on their assigned role, STRATAFOLIO provides both transparency and security. Organizations can give investors confidence in their reporting while ensuring private financial information is not shared beyond what is necessary.
Example Views Between Both Types of Investor Roles
To better understand the difference, here are examples of what investors might see:
- Restricted Access Investor View: Displays high-level totals, including total contributions, total distributions, and the last distribution amount. The interface is simple and streamlined, designed for investors who only need summary data.
- Full Access Investor View: Shows a more detailed table with contributions, distributions, annualized returns, and breakdowns by entity. This provides a deeper look at how the investor’s money is working within the organization.
Graphical View of Distributions
For both types of investor access, investors can easily visualize their performance through the Graphical View of Distributions. To access it, navigate to the Investor Dashboard, select Distributions, then select the distribution period for which they want to see the graphical view.
This view shows:
- Total Investment Contributions
- Total Distributions to Date
- Trailing 12-Month Distributions and Cash-on-Cash Return
- A historical chart displaying annualized cash-on-cash returns over time
- A detailed table with investment dates, contributions, distributions, and monthly returns
STRATAFOLIO designed this view because many investors wanted to monitor their real estate performance the same way they track their stock portfolios. With the chart and return metrics, investors can quickly see how their contributions have performed historically and where their returns stand today.
To get the most out of this feature, investors can use the filters at the top of the page to narrow the view by a specific investment or distribution period. This makes it easier to analyze the performance of a single asset or focus on returns within a certain timeframe. Reviewing the trailing 12-month return alongside the historical chart also provides a balanced perspective of both recent and long-term performance. And if additional analysis or sharing is needed, the data can be quickly exported to Excel, CSV, or PDF.
Summary
The Investor Dashboard in STRATAFOLIO is an essential tool for building trust with investors. By providing a clear snapshot of contributions, distributions, and returns, the dashboard makes it easier for investors to stay informed. The level of detail displayed depends entirely on the role assigned to the investor:
- Full Access Investors see detailed financials and entity-specific information.
- Restricted Access Investors see a high-level overview limited to their own contributions and distributions.
With this role-based approach, STRATAFOLIO ensures each investor gets the information they need, no more, no less.