About STRATAFOLIO
This is the all-in-one guide to the STRATAFOLIO platform. STRATAFOLIO is a cloud-based asset management tool built for people who own or manage commercial real estate.
It brings together data from QuickBooks Online and QuickBooks Desktop into one centralized system, providing real-time visibility across all your entities, assets, leases, loans, and investors.
By integrating financial and operational data, STRATAFOLIO helps you:
- Streamline accounting and reporting across multiple companies
- Automate lease management, rent escalations, and invoicing
- Monitor debt, equity, and asset performance in one place
- Simplify communication with tenants, lenders, and investors
- Operate your portfolio more efficiently and profitably
Our mission is to help you connect, automate, and profit, eliminating the inefficiencies of spreadsheets and manual data entry so you can focus on growing your portfolio.
Note: In all written and visual materials, STRATAFOLIO is referred to as a platform (not an app, software, or system).
How STRATAFOLIO Is Structured
STRATAFOLIO is built around a hierarchical structure that mirrors how most real estate organizations are managed in the real world.
This structure ensures data accuracy, consistency, and transparency across your entire portfolio, no matter how many entities or assets you manage.
Hierarchy Overview
At the highest level is your Organization.
Within each Organization, you can have multiple Entities, and each Entity can contain one or more Assets, Buildings, and Units.
Organization → Entity → Asset → Building → Unit
Every lease, tenant, loan, and investor record connects to this hierarchy so that all data flows upward and can be viewed in context.
Each level in the hierarchy provides both a summary view (Index View) and a detail view for drilling into specific records.
The Purpose of this Guide
This guide provides a visual overview of the STRATAFOLIO platform, including its navigation structure, index and detail views, dashboards, and forms.
It’s designed to help users understand how to navigate between different organizational levels, locate information quickly, and maximize the value of the platform’s connected data views.
Symbols
Throughout the STRATAFOLIO platform, you’ll see various icons and symbols that help guide your navigation and actions.
Understanding what these symbols mean will make it easier to move through the platform confidently and identify where to perform certain tasks.
Below are the most commonly used symbols and their meanings:
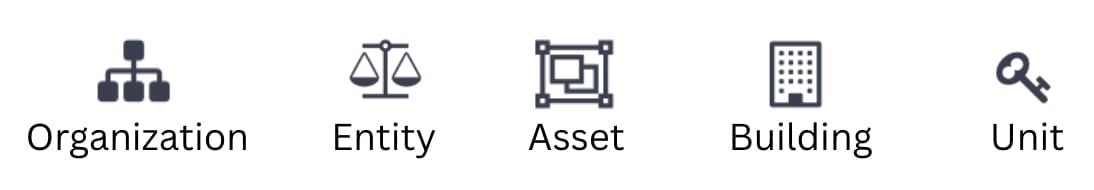
Core Hierarchy Icons
These icons represent the structural hierarchy of your organization. You’ll see them throughout the platform, particularly in the left-side navigation and breadcrumbs.
Functional Icons
These symbols appear frequently across pages and actions within STRATAFOLIO:
- Pencil/Edit: Indicates that the record or field can be edited. Select this icon to make changes.
- More Options: Opens additional settings or actions related to that record.
- Warning: Highlights alerts or required actions, such as missing information or upcoming expirations.
- Information/i: Provides additional context or explanation about a field or process. Hover or select to read details.
- Portal: Links to an external or tenant-facing page, such as the Tenant Portal.
Recognizing and using these visual cues helps you quickly understand what actions are available on any screen and ensures a smoother navigation experience throughout the platform.
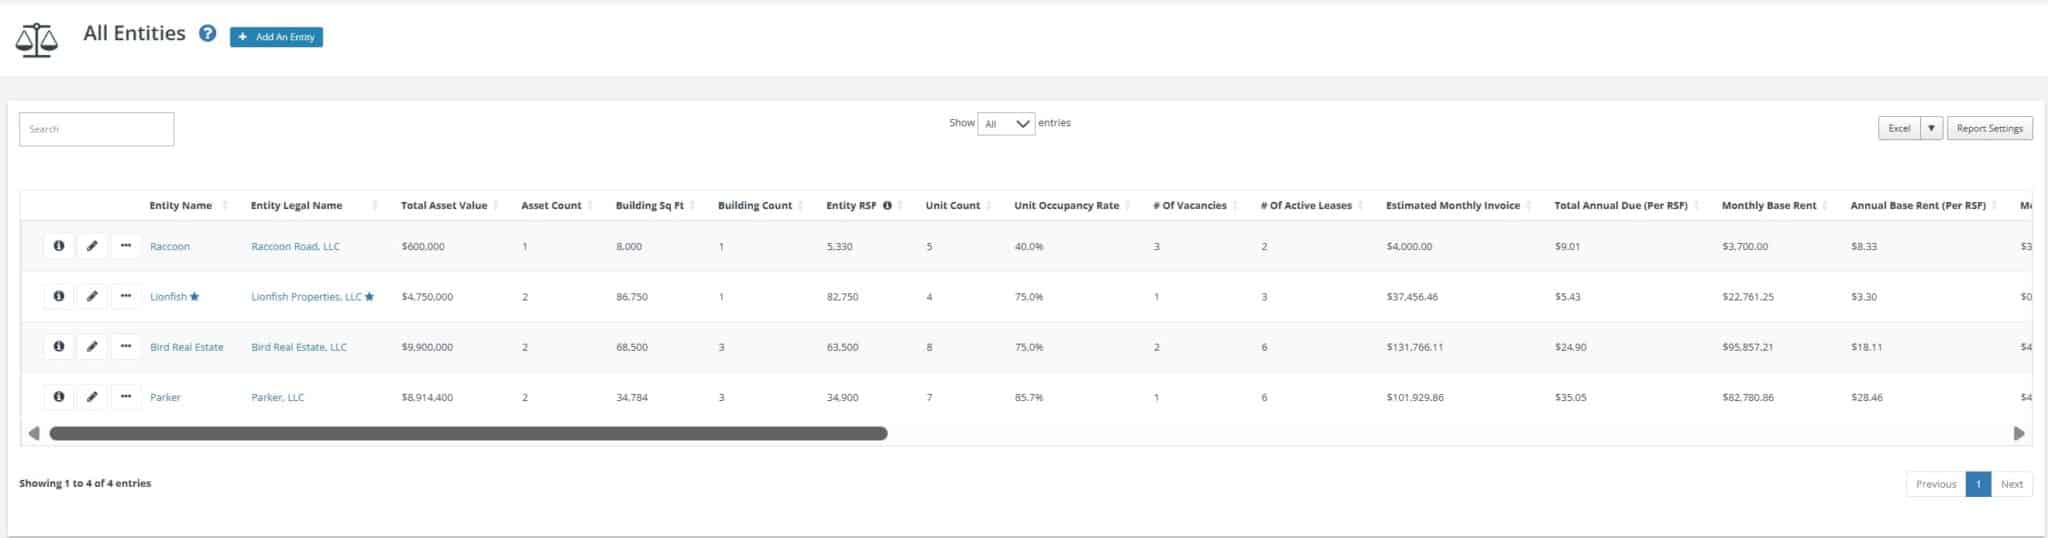
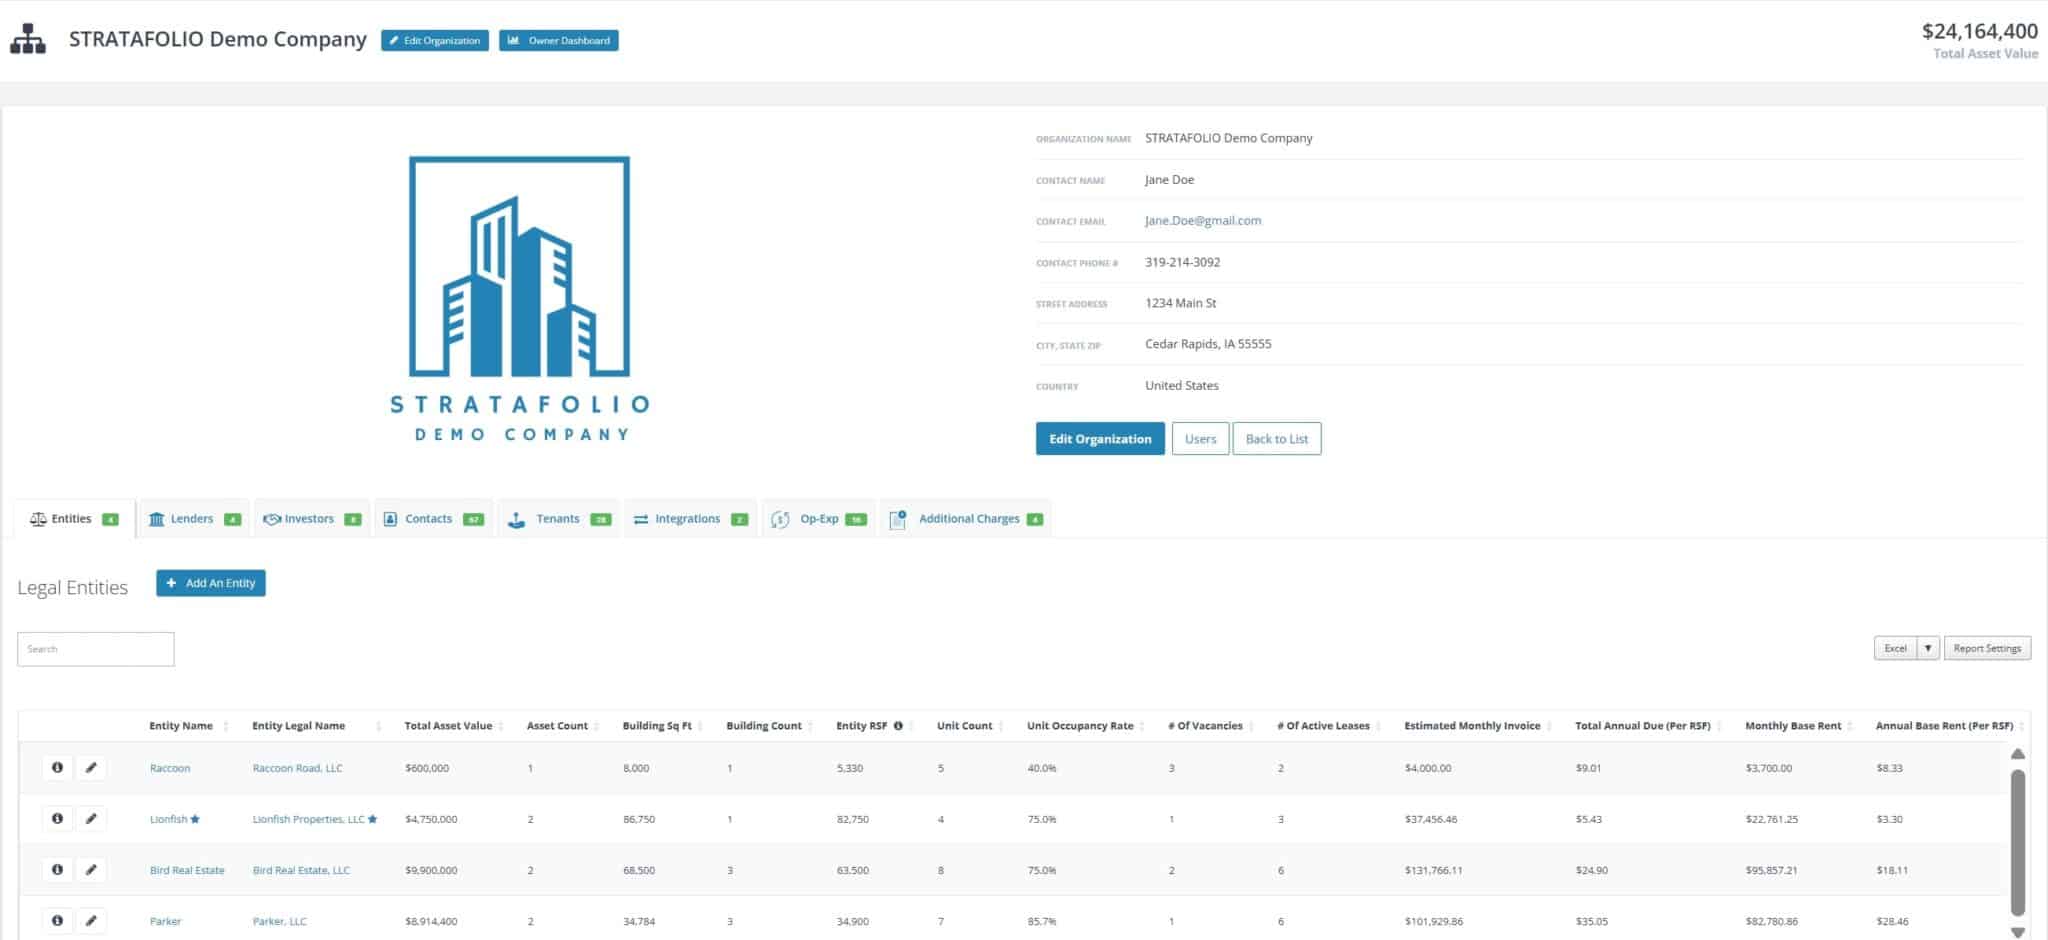
Index Views
The Index View serves as your master list for a specific record type (for example, Tenants, Leases, or Assets).
From here, you can search, sort, or filter data, and select any blue, hyperlinked item to open its corresponding detail view.
Example:
- Tenant Index View: A table listing all tenants within your organization
- Lease Index View: Displays all active and historical leases with filtering options
Detail Views
When you select a record from an Index View, you’ll enter its Detail View.
Each detail view contains all the information specific to that record, often divided into tabs for related data (for example, Financials, Notes, and Documents). If you’re not seeing the information you’re looking for, try switching to another tab.
The highlighted item in the left-side navigation menu and the breadcrumb trail at the top of the page indicate exactly where you are in the hierarchy.
Furthermore, it is also helpful to be familiar with the icons that show beside each hierarchical level. See section on symbols.
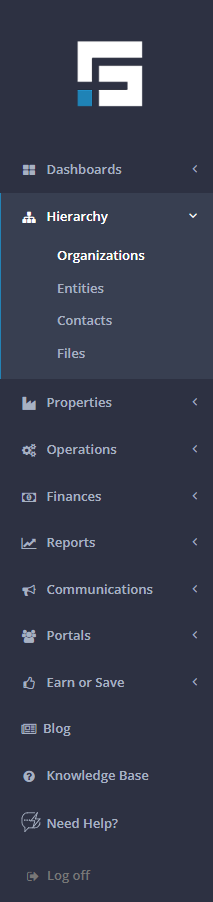
Navigation and Consistency
- The left-side navigation always reflects your position in the hierarchy.
- Breadcrumbs show your exact path (for example, Organization → Entity → Asset).
- Tabs and dashboards provide deeper context and visuals, helping you move efficiently between related areas without losing your place.
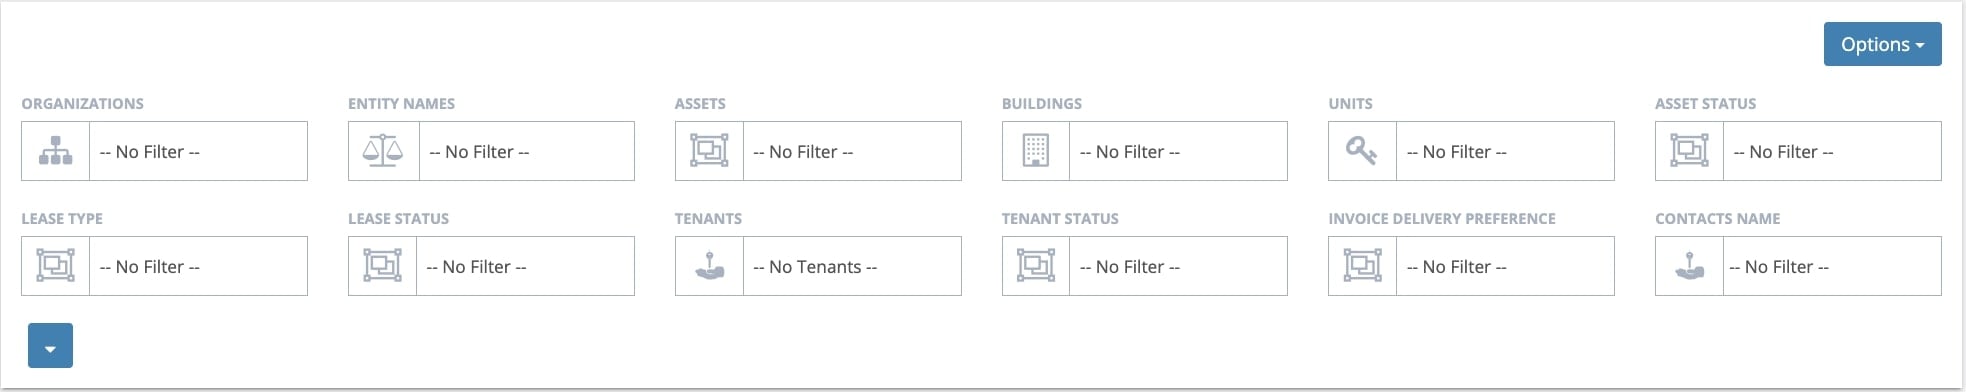
Dropdown Filters
The Dropdown Filters in STRATAFOLIO appear directly above most tables throughout the platform. These filters are designed to help you quickly locate, organize, and analyze the exact information you need without scrolling through long lists of data.
How Dropdown Filters Work
Each dropdown represents a key data category, such as Entity, Asset, Building, Unit, or Status.
You can select any dropdown to view a list of available options, then select one or more filters to narrow your view.
For example:
Select Entity: Lionfish LLC to view only records belonging to that entity.
Add Status: Active to further limit results to currently active leases or tenants.
STRATAFOLIO’s dropdown filters are multi-select, meaning you can apply several filters at once to isolate specific information.
This makes it easy to focus on a single organization, property, or record type, while still maintaining visibility across your connected portfolio.
Why It’s Useful
- Faster navigation: Quickly drill down to what matters most without running separate reports.
- Custom views: Combine filters to create dynamic, personalized data views.
- Better data control: Isolate and analyze subsets of information for auditing, reporting, or operational decision-making.
Tip
When multiple filters are applied, a small indicator will appear beside each active filter. You can remove filters one by one or clear all at once to return to the full dataset.
AI Assistant
STRATAFOLIO’s AI Assistant is your built-in support tool designed to help you navigate the platform, find information quickly, and get answers in real time.
It acts as your virtual guide within the platform, providing instant assistance without needing to leave your current view.
Where to Find It
You can access the AI Assistant in two convenient ways:
- From the left-side navigation panel, under Knowledge Base


- By selecting the chat icon located at the top right corner of the platform, beside your profile

Both options open the AI Assistant window, where you can type questions or requests directly.
What You Can Do
Use the AI Assistant to:
- Get step-by-step guidance on how to perform actions within STRATAFOLIO
- Understand features, dashboards, and reports
- Find definitions or explanations of key terms (for example, “What is the Lease Abstract?”)
- Troubleshoot navigation or data-entry issues
- Access links to related Knowledge Base articles
Why It’s Helpful
The AI Assistant allows you to get answers instantly without interrupting your workflow. Whether you’re learning the platform for the first time or need a quick reminder of where to find something, it’s available anytime, right where you work.
If the AI Assistant is unable to respond in a way that directly addresses your concern, submit a ticket to the STRATAFOLIO team by going here.
Export and Report Settings
The Export and Report Settings functions in STRATAFOLIO allow you to extract and customize the data displayed within your tables, making it easier to analyze, share, and present key information outside the platform.
These options appear above most tables and dashboards, giving you full control over what data you view and how you save it.
Export Function
The Export button enables you to download the data currently visible in your table into a shareable file format (such as .CSV or .XLSX). This is ideal for reporting, auditing, or working with data in external tools like Excel or Google Sheets.
How it works:
- Apply any desired dropdown filters or column adjustments to the table.
- Select the Export button above the table.
- Choose your preferred export format.
- Download and save the file locally.
Important Note:
The exported data will always reflect whatever is currently displayed on the table after applying filters, not the individual rows you’ve manually selected.
Even if you select the checkbox beside specific rows, your exported report will include all data that meets your active dropdown filter criteria.
Key Benefits:
- Export only the filtered data you need, exactly as displayed in STRATAFOLIO.
- Maintain consistent formatting and values between your on-screen view and your exported file.
- Easily share accurate, up-to-date reports with team members, investors, or lenders.
Report Settings
The Report Settings button allows you to control which columns or data fields appear in your current table view. You can tailor reports to focus on the metrics that matter most to your workflow. Note that the Filters and Report Settings work together but serve different purposes. Filters determine which data rows appear in the table. Report Settings determine which columns or data fields are visible.
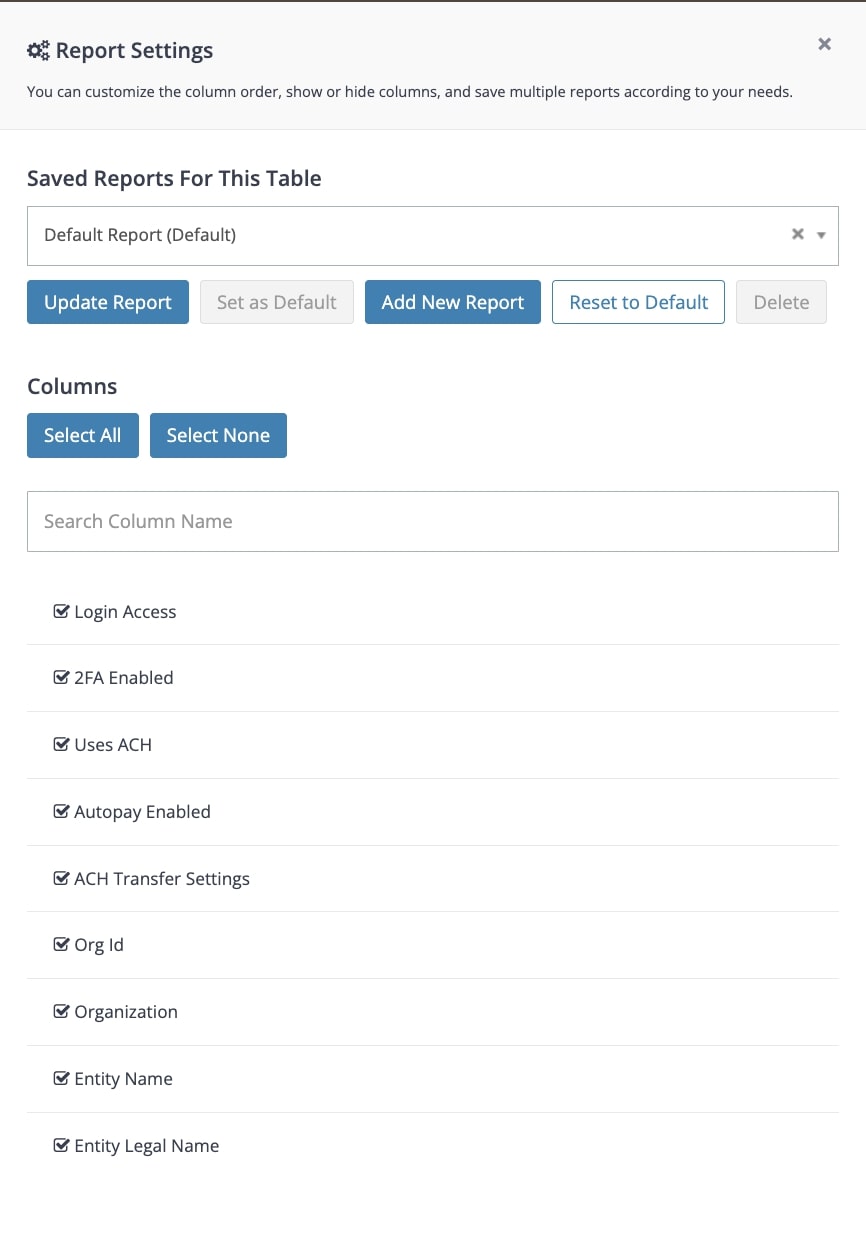
How it Works:
- Select Report Settings to open the customization panel.
- Select or deselect specific data fields to display or hide them from your table.
- Save your view and label it to maintain consistency across sessions.
- Once you’ve customized your columns and saved a report, it’s stored in the Saved Reports dropdown. The next time you open the table, simply select that saved report from the list, it will automatically apply your saved column settings.
Key Benefits:
- Customize reports to your audience (for example, financial vs. operational views).
- Simplify data presentation by hiding unnecessary columns.
- Combine with filters and exports for precise, targeted reporting.
My Profile and Alerts
The My Profile section allows each user to manage their personal information, account settings, and system alerts, all in one place.
The My Profile section allows each user to manage their personal information, account settings, and system alerts, all in one place.
Personal Info Tab
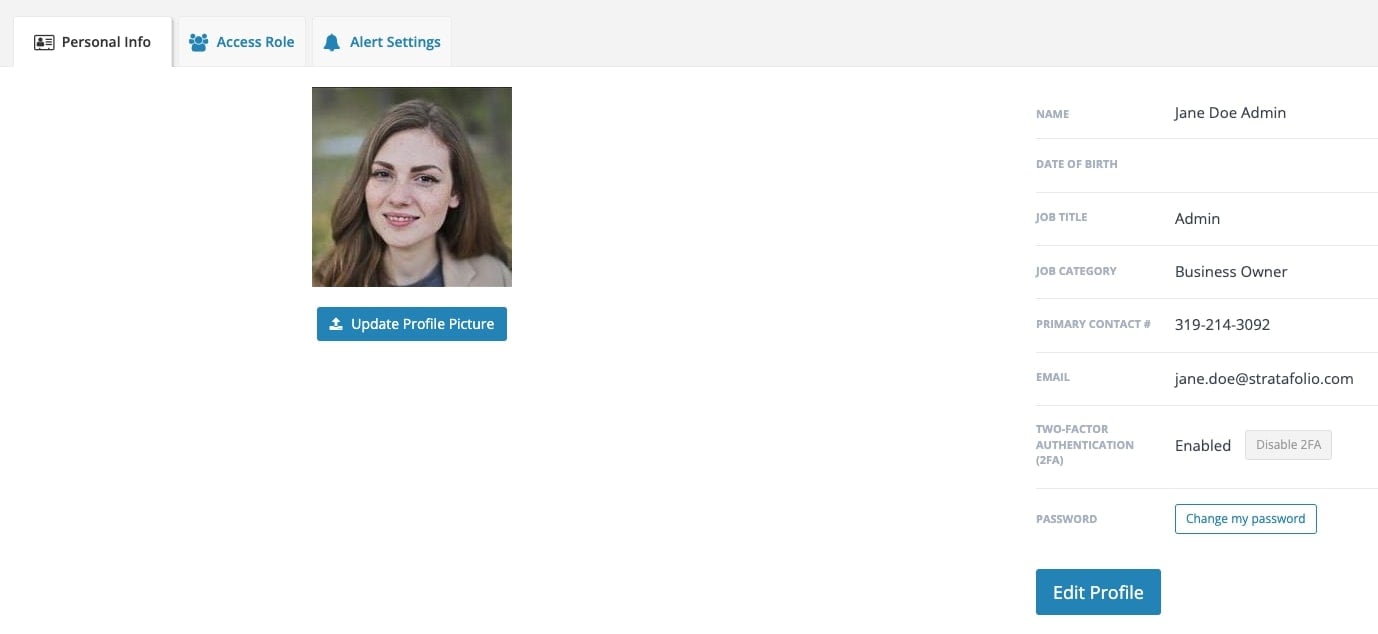
This tab displays your user details including your name, job title, contact information, and role type.
From here, you can:
- Edit your profile and update your personal or contact details.
- Change your password or enable/disable Two-Factor Authentication (2FA) for added security.
Access Roles Tab
The Access Roles tab provides an overview of all organizations you have access to and your corresponding role for each.
You can view:
- Your access level (e.g., Administrator, Manager, Viewer).
- The organization name and contact details.
- Linked contact information such as emails and phone numbers.
This helps you verify your permissions across multiple organizations connected to STRATAFOLIO.
Alert Settings Tab
The Alert Settings tab allows you to customize which alerts you receive within the platform.
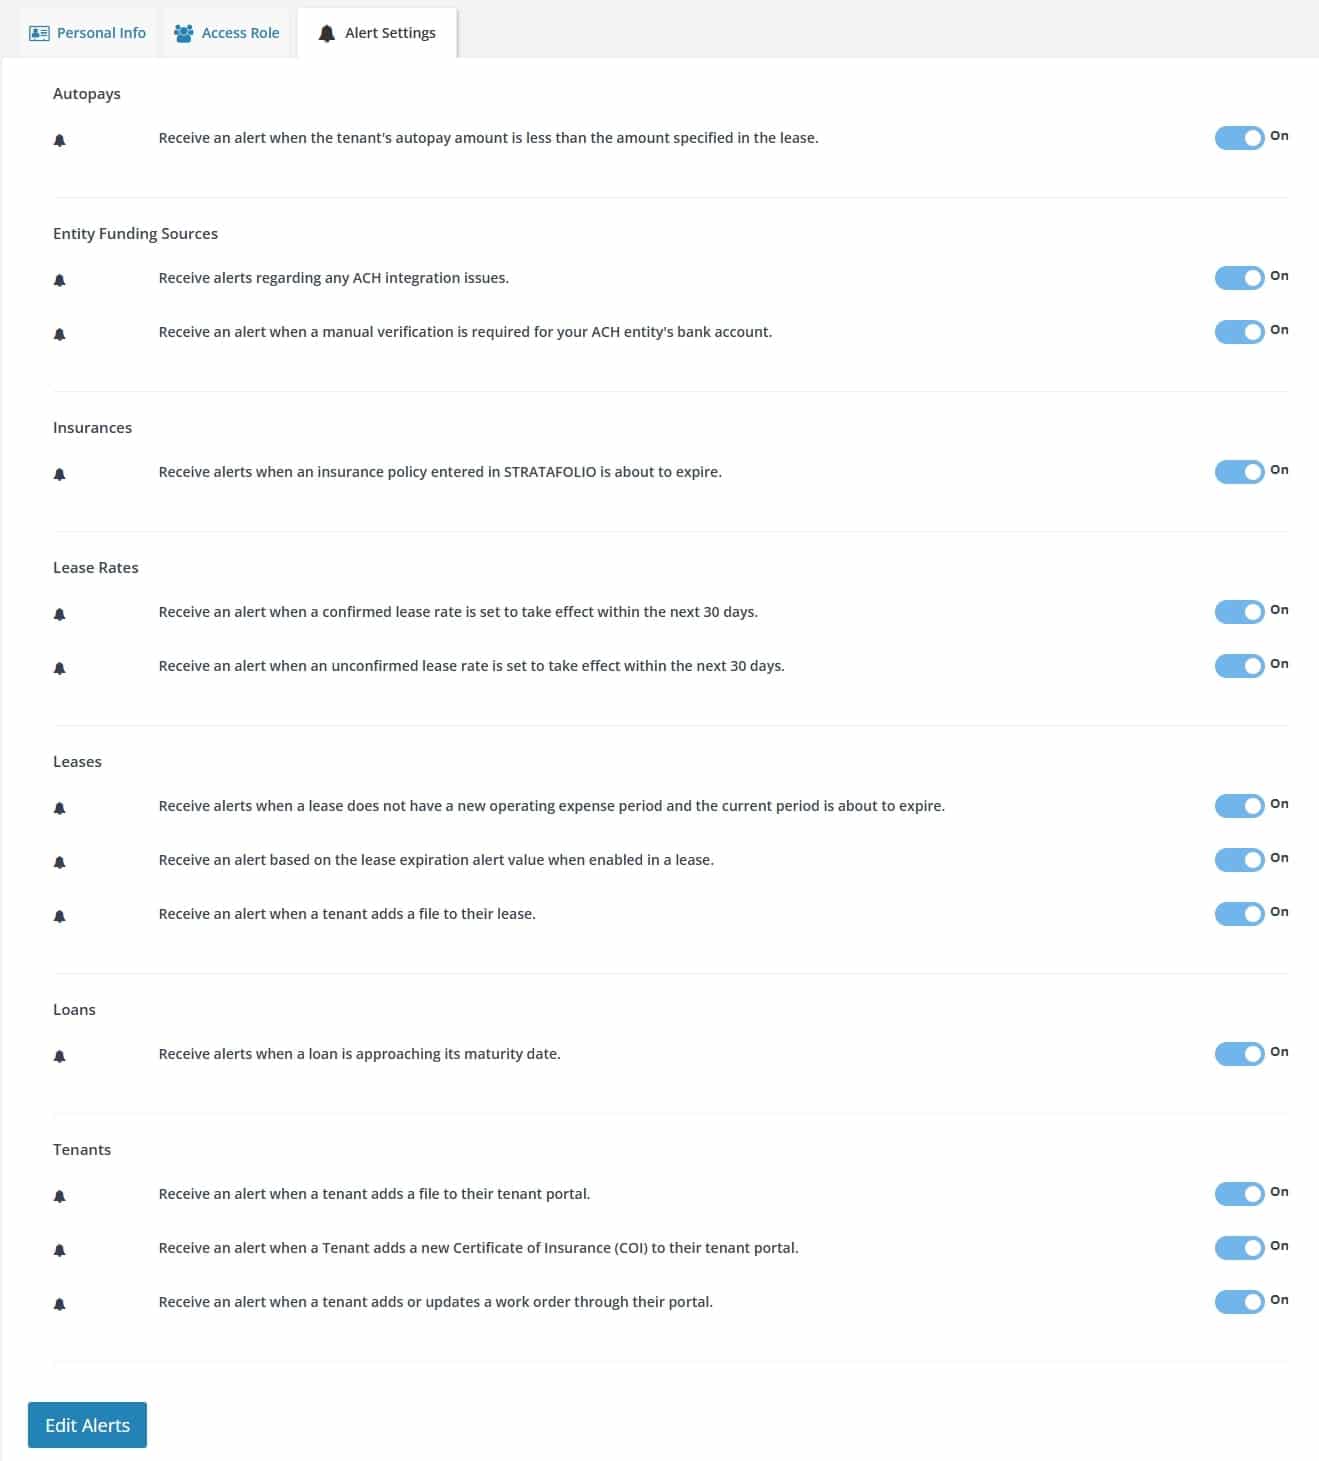
You can toggle notifications on or off for key categories such as:
- Autopays: Receive alerts when a tenant’s autopay amount is lower than the lease amount.
- Entity Funding Sources: Get notified when ACH integration or manual bank verification requires attention.
- Insurances: Stay updated on upcoming policy expirations.
- Lease Rates & Leases: Get alerts for upcoming lease escalations, expirations, or missing data.
- Loans: Be notified when loans are nearing their maturity date.
- Tenants: Receive alerts when tenants upload new files, COIs, or work orders.
Tip: You can edit all alerts at once using the Edit Alerts button at the bottom of the page.
Owner Dashboard
The Owner Dashboard provides a comprehensive financial overview of your organization’s portfolio on a cash basis, helping you see where money is flowing in real time.
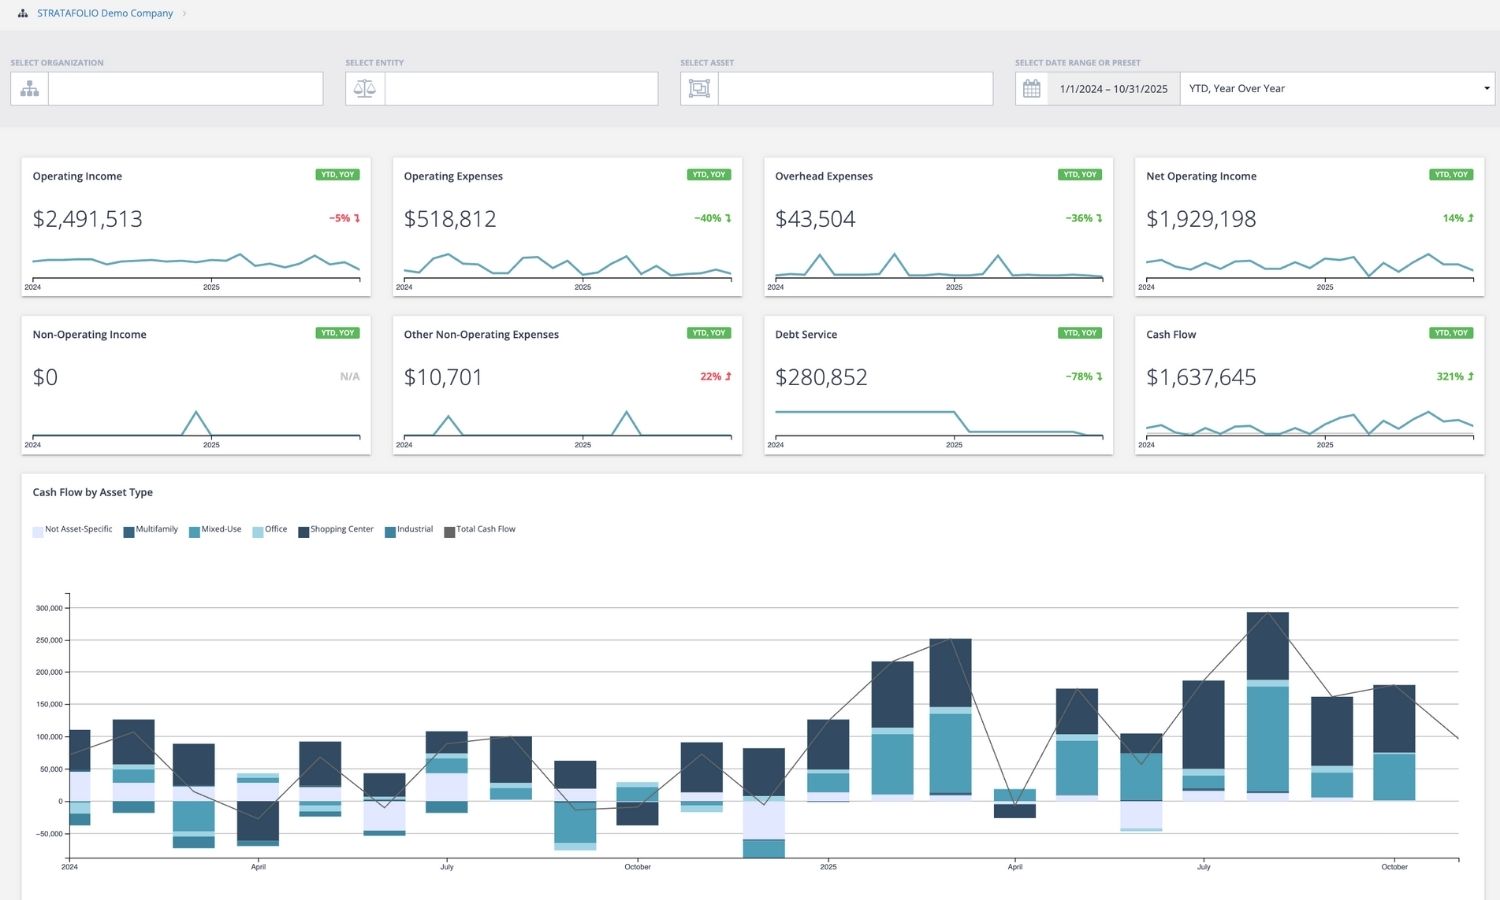
It consolidates data across entities, assets, and properties to give you a clear picture of both principal and interest payments, income, and expenses. You can view results at multiple levels across your entire portfolio (global cash flow), by a single entity, or by asset class.
At the top of the dashboard, you can use filters to adjust the time period or isolate specific entities or assets. This lets you quickly compare performance and track trends across different timeframes.
Where to Find It
You can access the Owner Dashboard from the left-side navigation panel under Dashboards → Owner Dashboard.
What It Shows
The Owner Dashboard presents key financial metrics and visual insights that help you monitor portfolio-wide cash flow on a cash basis, including:
- Operating Income & Expenses: Track day-to-day revenues and costs across your portfolio.
- Non-Operating & Overhead Expenses: View indirect or one-time costs.
- Debt Service (Principal & Interest): Monitor loan payments and their impact on cash flow.
- Net Operating Income (NOI): Quickly gauge profitability trends.
- Cash Flow by Asset Type or Entity: See income distribution by property class or organization.
Note: The Cash Flow Report is view-only to help you focus on real-time data. Use a screenshot to capture and share the current view anytime.
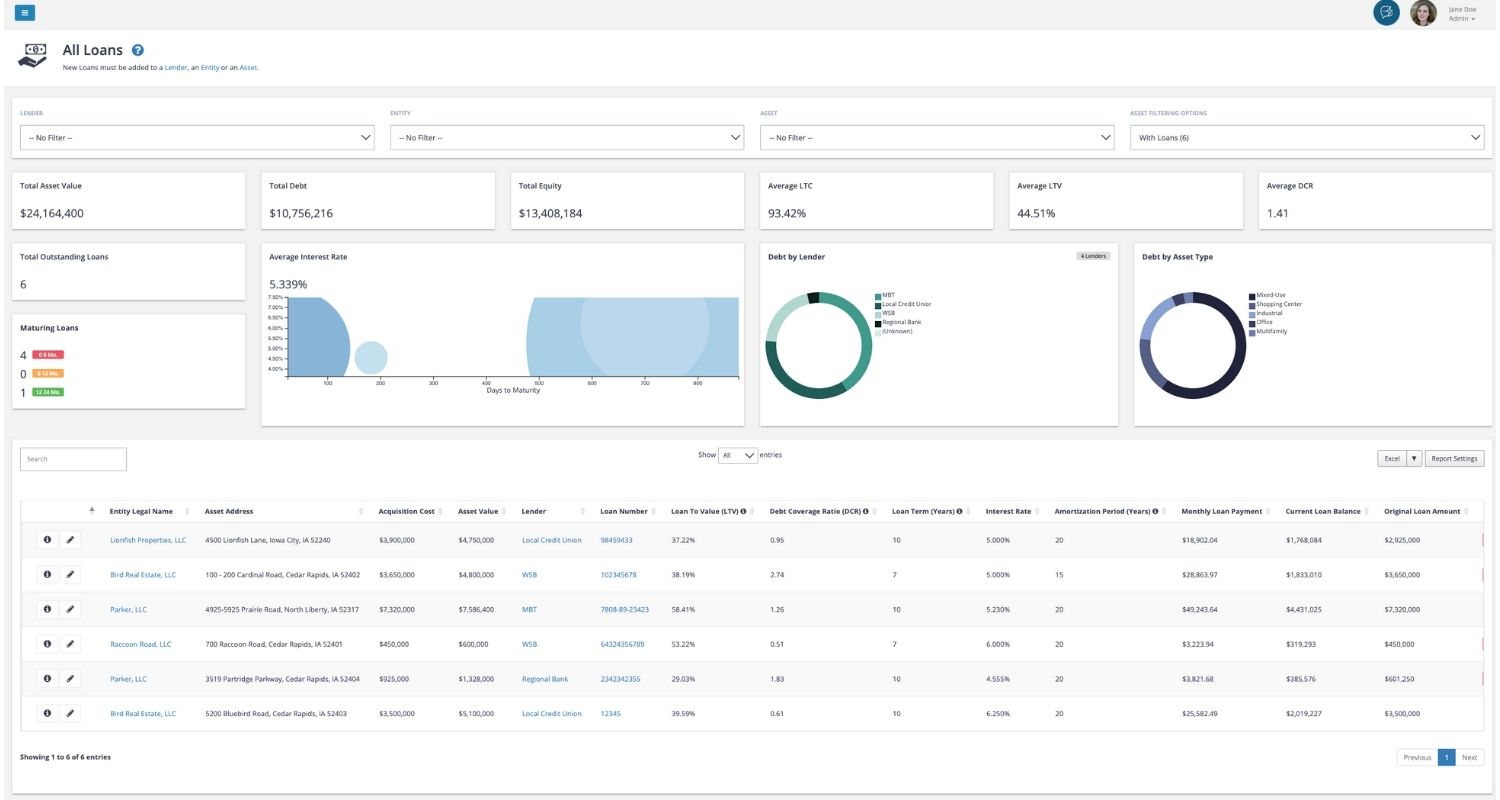
Loan Dashboard
The Loan Dashboard provides a centralized view of all your organization’s debt-related information. It brings together data from multiple entities and lenders, allowing you to track total loan exposure, monitor maturity timelines, view average interest rates, and analyze loan performance with interactive filters and real-time data.
Where to Find It
You can access the Loan Dashboard from the left-side navigation panel under Finances → Loans.
What It Does
The Loan Dashboard helps you understand and manage your organization’s debt portfolio through real-time data and visual insights.
At the top of the dashboard, filters allow you to narrow the data displayed. You can filter by Entity, Asset, Lender, Loan Type, or Date Range to quickly isolate specific loans or view portfolio-wide totals.
Key functions include:
- View total loan balance, total equity, and average interest rate across all selected loans.
- Track average loan-to-value (LTV) and debt service coverage ratio (DSCR) to monitor portfolio health.
- Identify maturing loans that may need refinancing or renewal.
- Review loan distribution by lender, entity, or asset type with visual breakdowns.
- Export loan data or adjust displayed columns using Report Settings for customized reporting.
Forms
Forms are used throughout the STRATAFOLIO platform to enter, edit, or update information about records such as tenants, leases, assets, contacts, and more. Regardless of how they appear on screen, all data entry interfaces within STRATAFOLIO are referred to as forms.
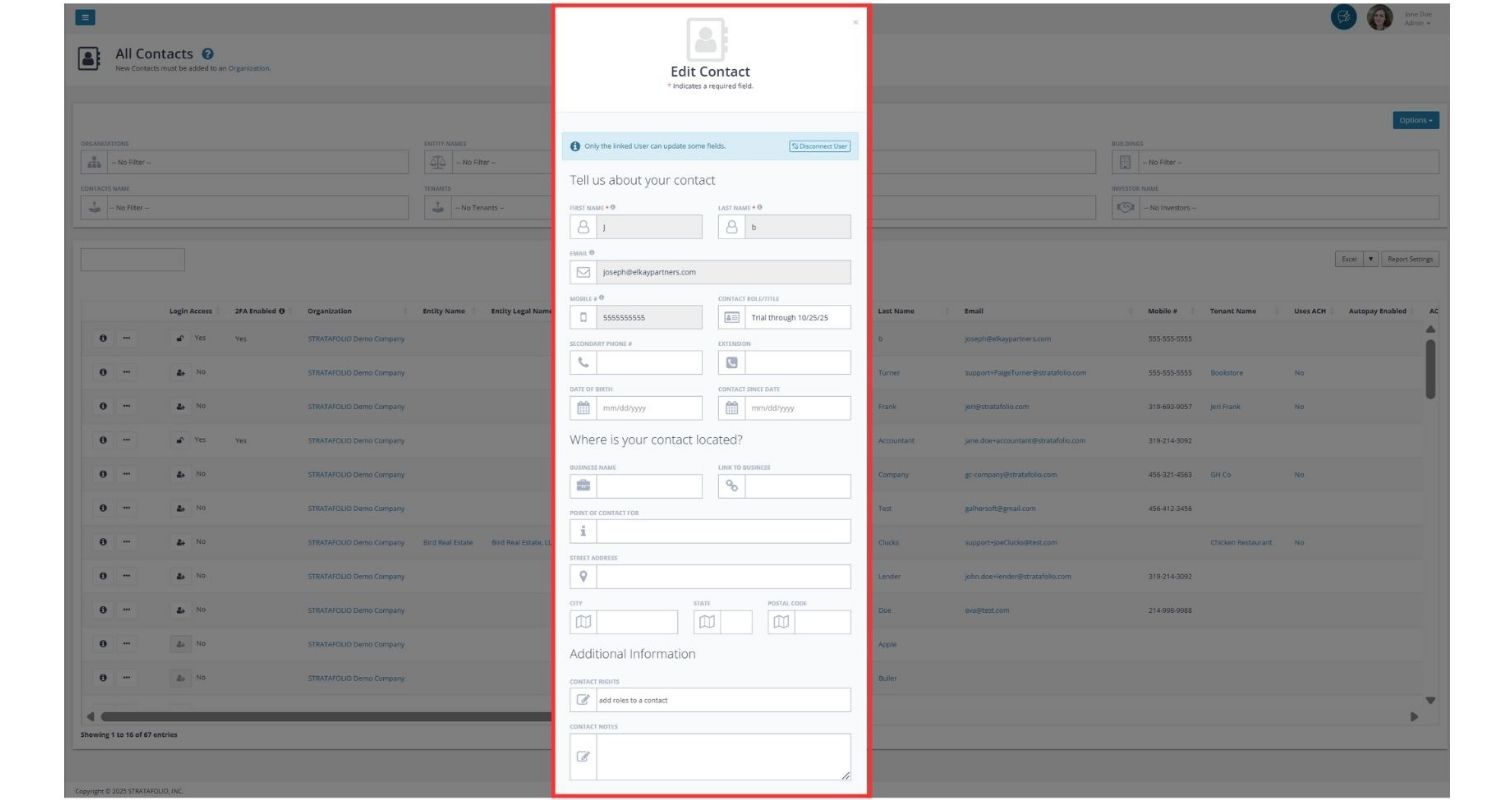
Two Display Types
A Pop-Up Form appears as an overlay window on top of the current page. It’s commonly used for quick edits or small data entries such as updating contact information or editing a single field.
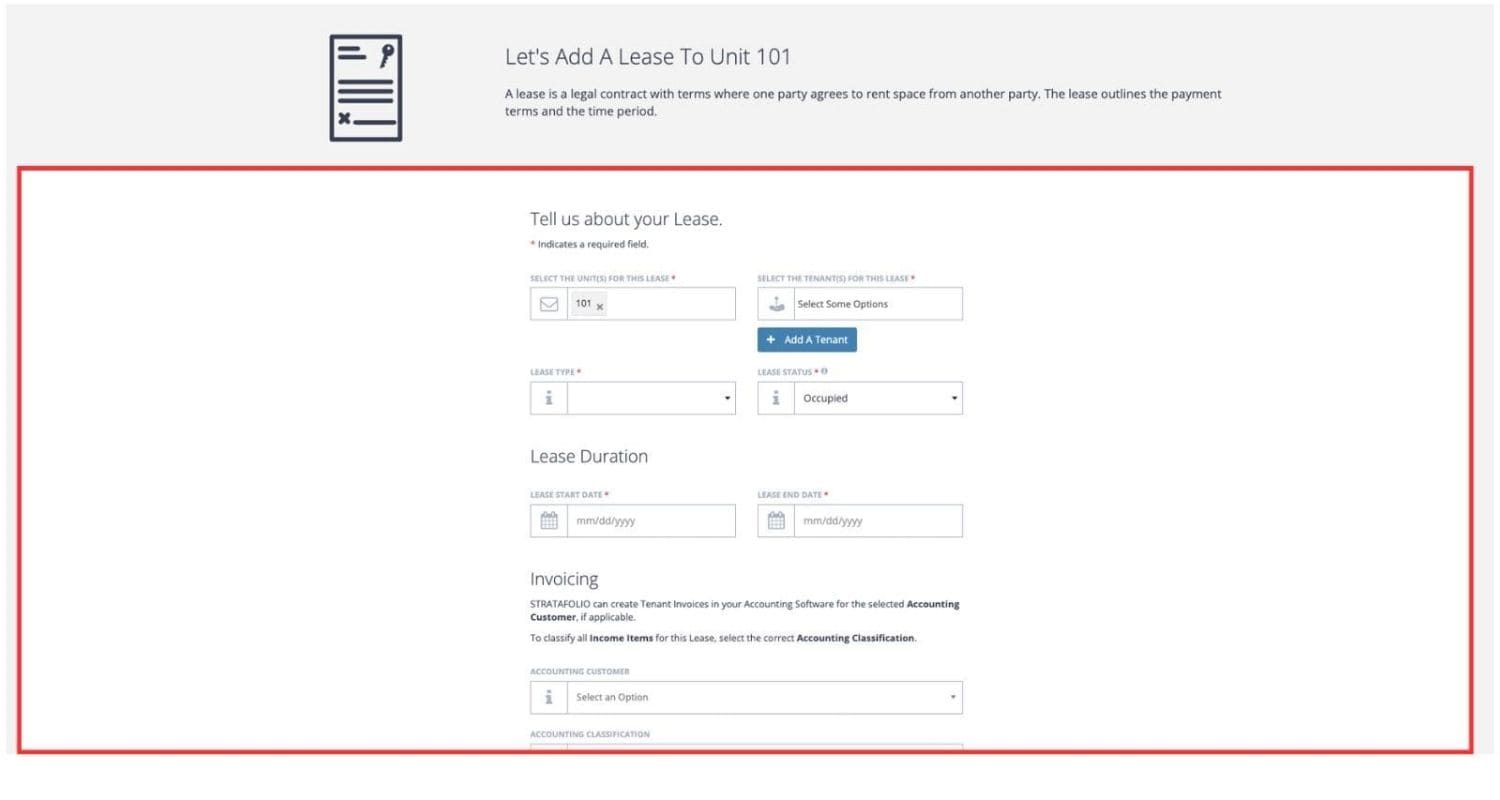
A Full-Screen Form opens as a dedicated page within the platform. It’s typically used for more detailed or multi-step entries such as adding a new lease, asset, or tenant record.
Lease Abstract
The Lease Abstract is the central location for viewing all essential details related to a specific lease within STRATAFOLIO. It consolidates key financial, operational, and administrative information in one easy-to-navigate view, helping you monitor lease performance, terms, and obligations without switching between multiple pages.
Where to Find It
You can access the Lease Abstract by navigating to:
Operations → Leases → (select the “i” information icon beside a lease)
This opens the lease’s detailed view, where you’ll see the Lease Abstract tab displayed by default.
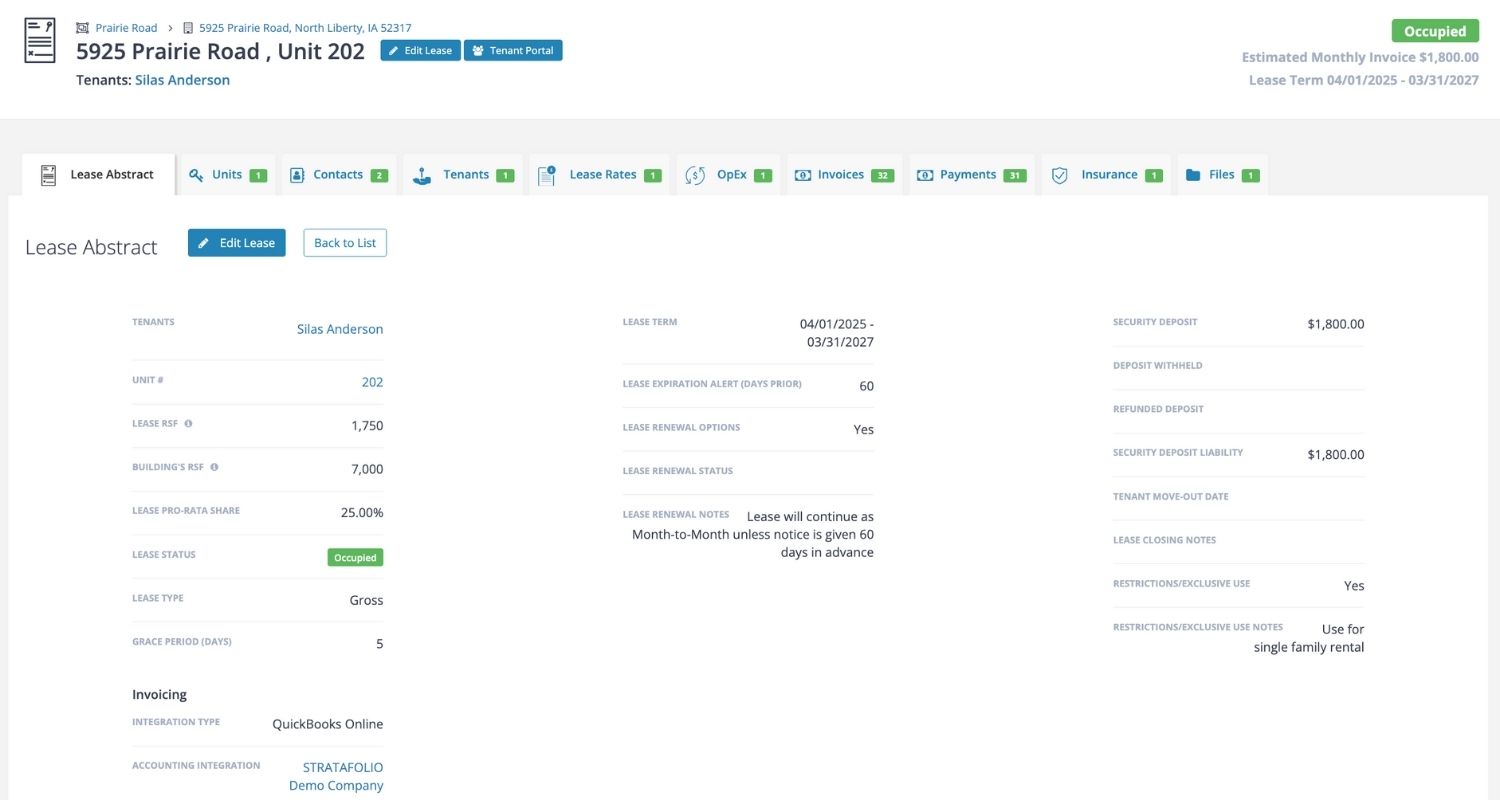
What It Shows
The Lease Abstract displays a comprehensive summary of each lease record, including:
- Tenant Details: Tenant name, contact, and assigned unit.
- Lease Term: Start and end dates, with the ability to set expiration alerts.
- Lease Type and Status: Indicates lease structure (e.g., NNN, Gross) and occupancy status (e.g., Occupied, Vacant).
- Lease Metrics: Square footage, building RSF, and pro-rata share.
- Security Deposits: Tracks deposit amounts, refunds, and liabilities.
- Invoicing Information: Links to accounting integration type, customer, and classification.
- Lease Renewal Details: Renewal options, notes, and alert reminders for upcoming expirations.
Navigation Tabs
Across the top of the Lease Abstract, you’ll find quick-access tabs linking to related sections, such as:
- Units: View connected units under this lease.
- Contacts: Linked tenant or lease contacts.
- Lease Rates: Rent schedule and escalation details.
- Op-Exp (Operating Expenses): Expense responsibilities and tracking.
- Invoices & Payments: Transaction history for billing and collections.
- Insurance & Files: Uploaded certificates of insurance and attached documents.
These tabs allow for easy cross-referencing and updates without leaving the lease view.
Why It’s Useful
The Lease Abstract provides a complete snapshot of every lease from basic terms to financial integration, helping you stay organized, prevent missed renewals, and maintain accurate accounting.