In STRATAFOLIO, a table is a grid of information displayed in rows and columns, similar to a spreadsheet. Tables show details about leases, tenants, payments, properties, and more. You can filter, arrange, and adjust these tables to match your workflow or format your reports.
This functionality makes it easy to customize reports in STRATAFOLIO so they display the information you want, in the way you prefer. Every user can create their own default view, build standard reports for easy access at any time, and even export results. These changes are specific to each user, so your preferences will not affect anyone else’s view.
How to Format Your Reports by Adjusting Tables
Create, Add, Remove, or Filter Columns
Start by choosing any view with a table you want to modify.
- Drag and drop columns: Select and hold the column header, then drag it into a new position.
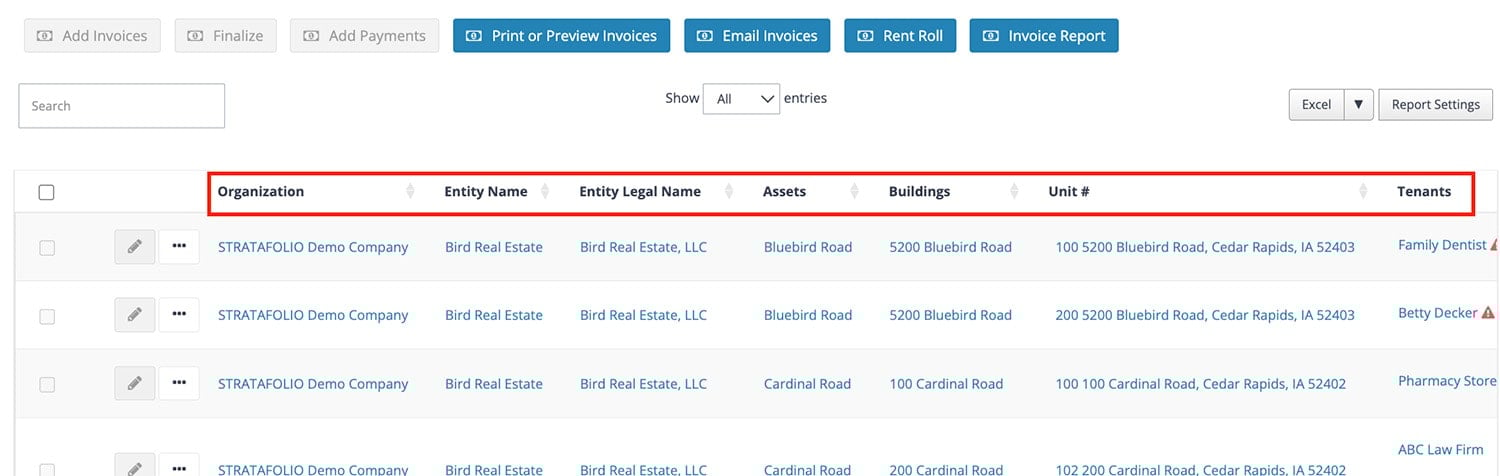
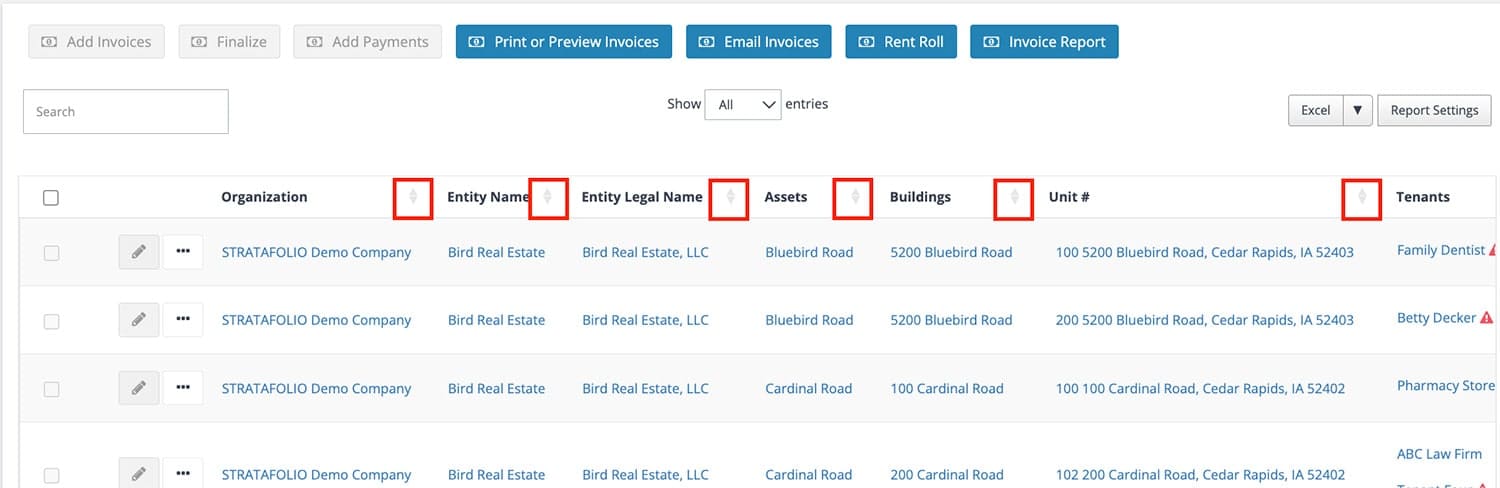
- Sort columns: Select the column header to toggle between alphabetical (A–Z) or numerical (1,2,3) sorting, and reverse order (Z–A or 3,2,1).
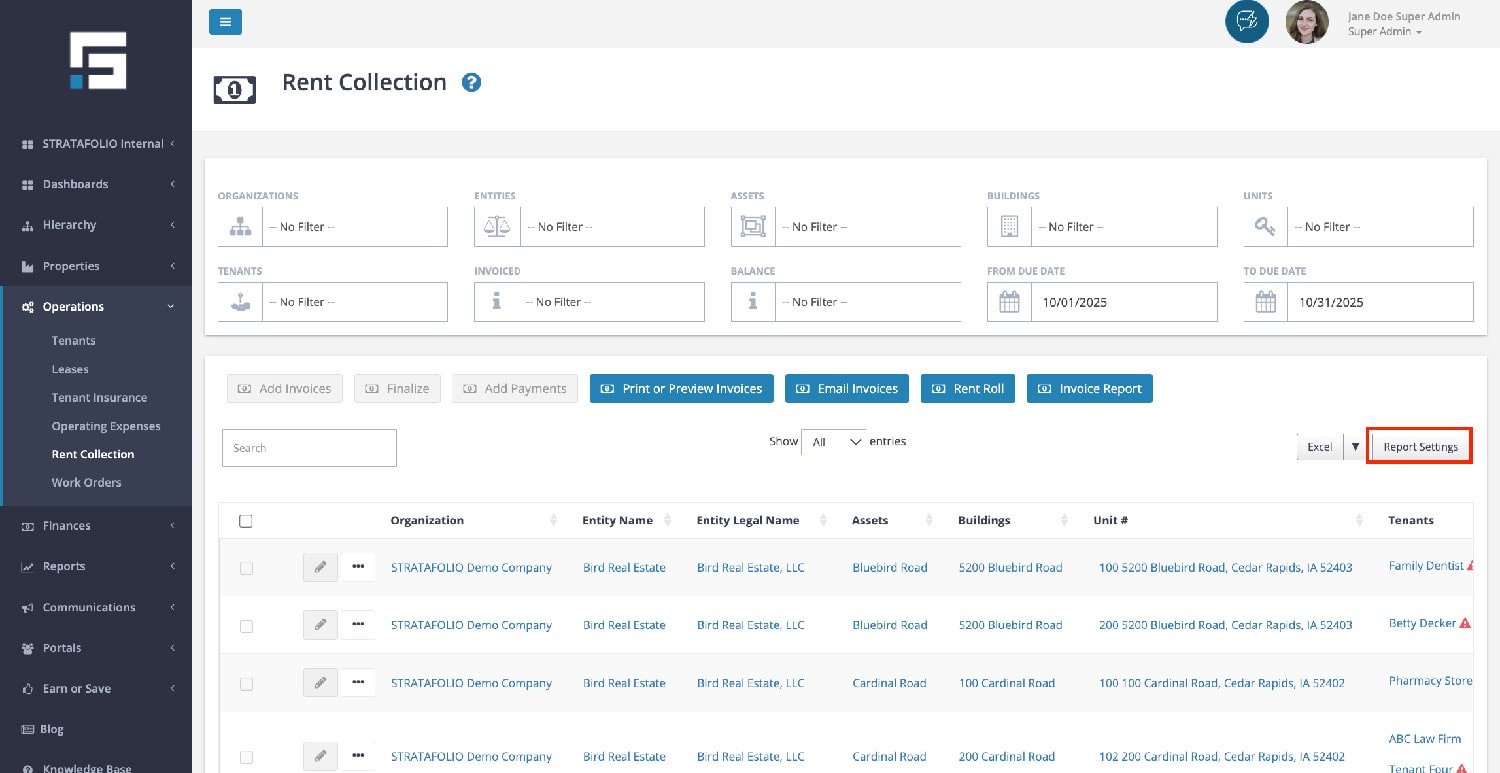
Next, navigate to the Report Settings above a table. A dialog box will open on the right side where you can adjust the data display.
Under Columns, you’ll see three quick options:
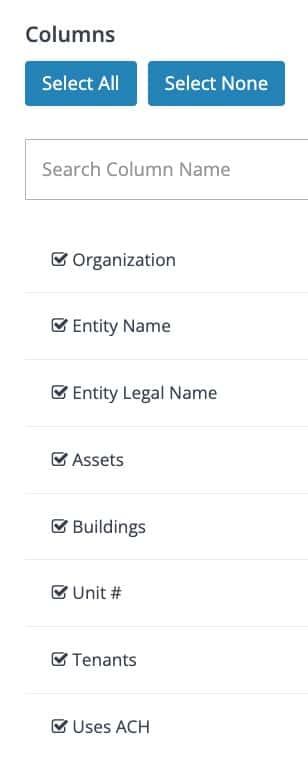
- Select All: Restores all columns in the table.
- Select None: Removes all columns, which is useful if you only want a few items displayed at a time.
- Checkbox control: Every available column has a checkbox. Mark a box to show that column, unmark it to hide the column.
This flexibility ensures you can build views that match your role, whether you’re preparing data for a lender, a property manager, or your internal accounting team.
How to Save a New Report
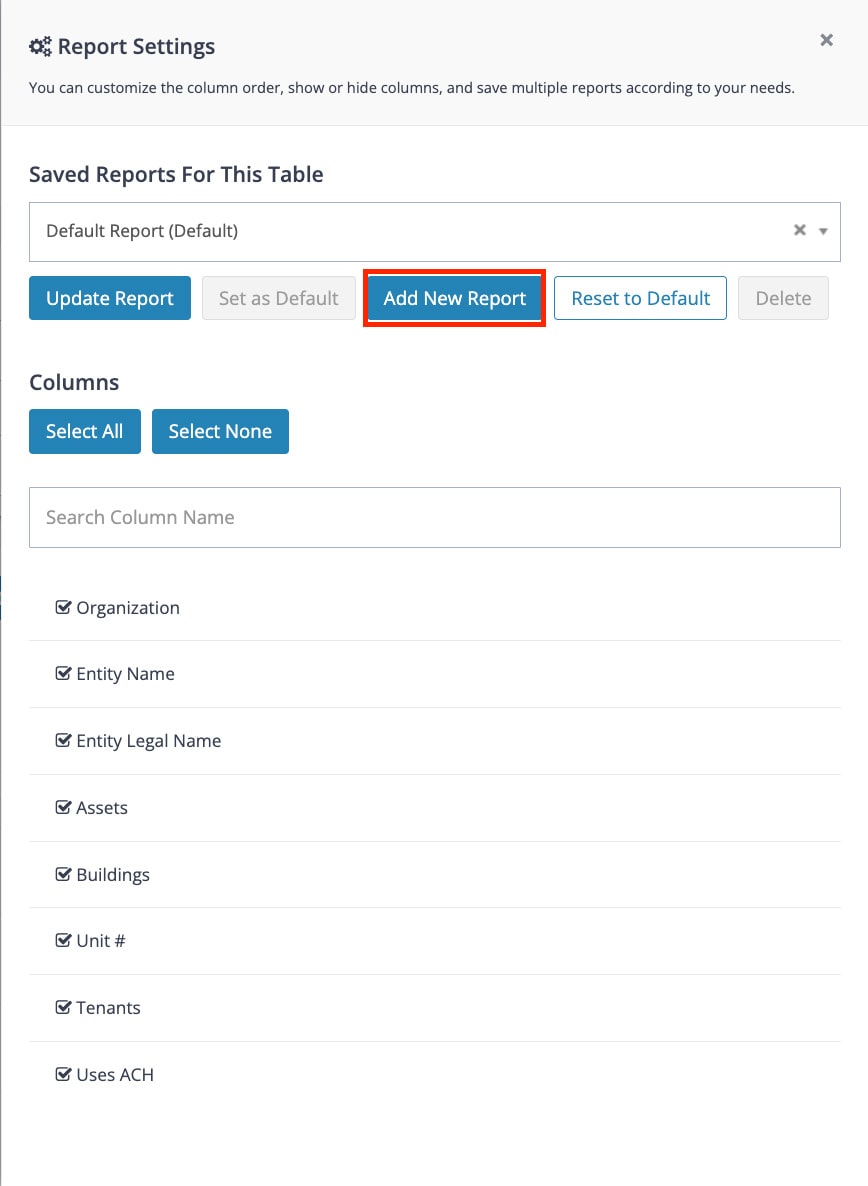
When your table displays the way you want, save it for future use by selecting Add New Report.
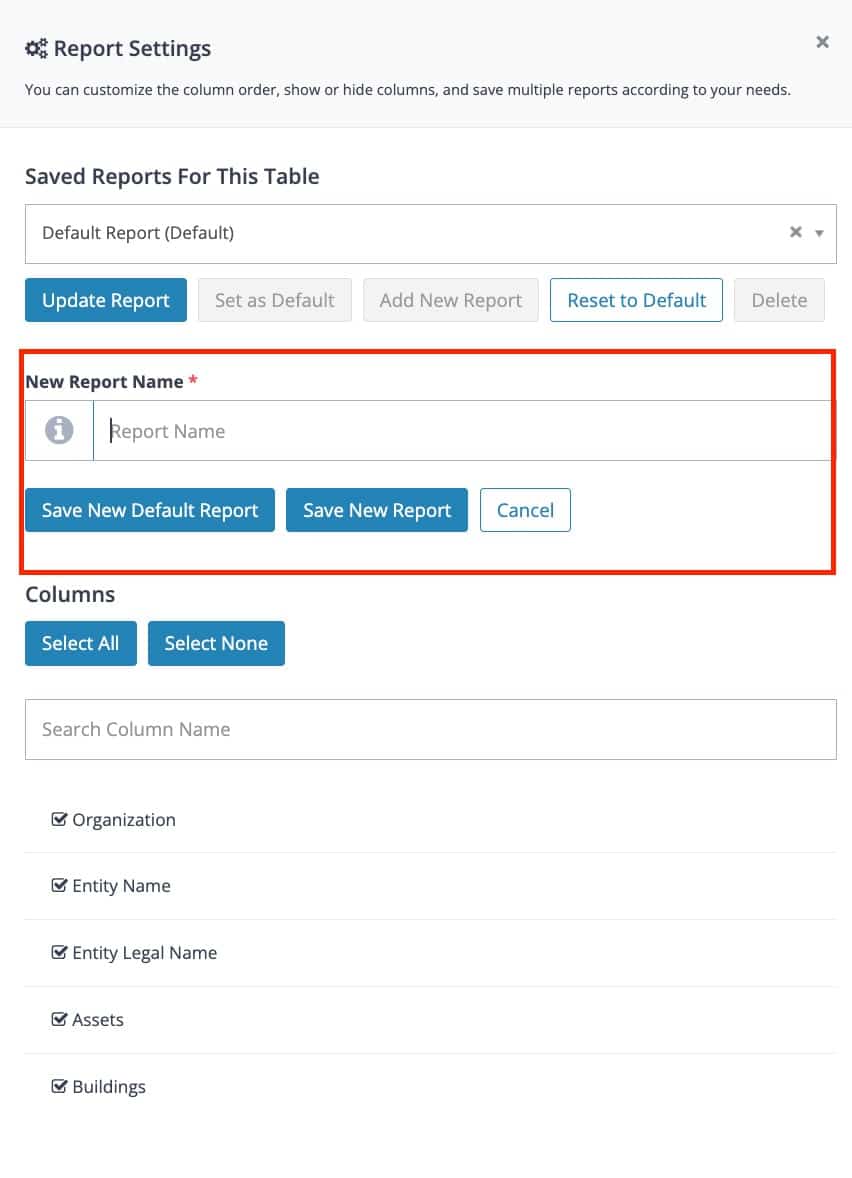
- A new section will appear to customize your new view.
- Enter a name and select Save New Report. The new profile will now appear in the drop-down menu at the top of the dialog box.
- To make it your default, select Save New Default Profile. This ensures your preferred setup loads automatically each time you return to that view, even after logging out.
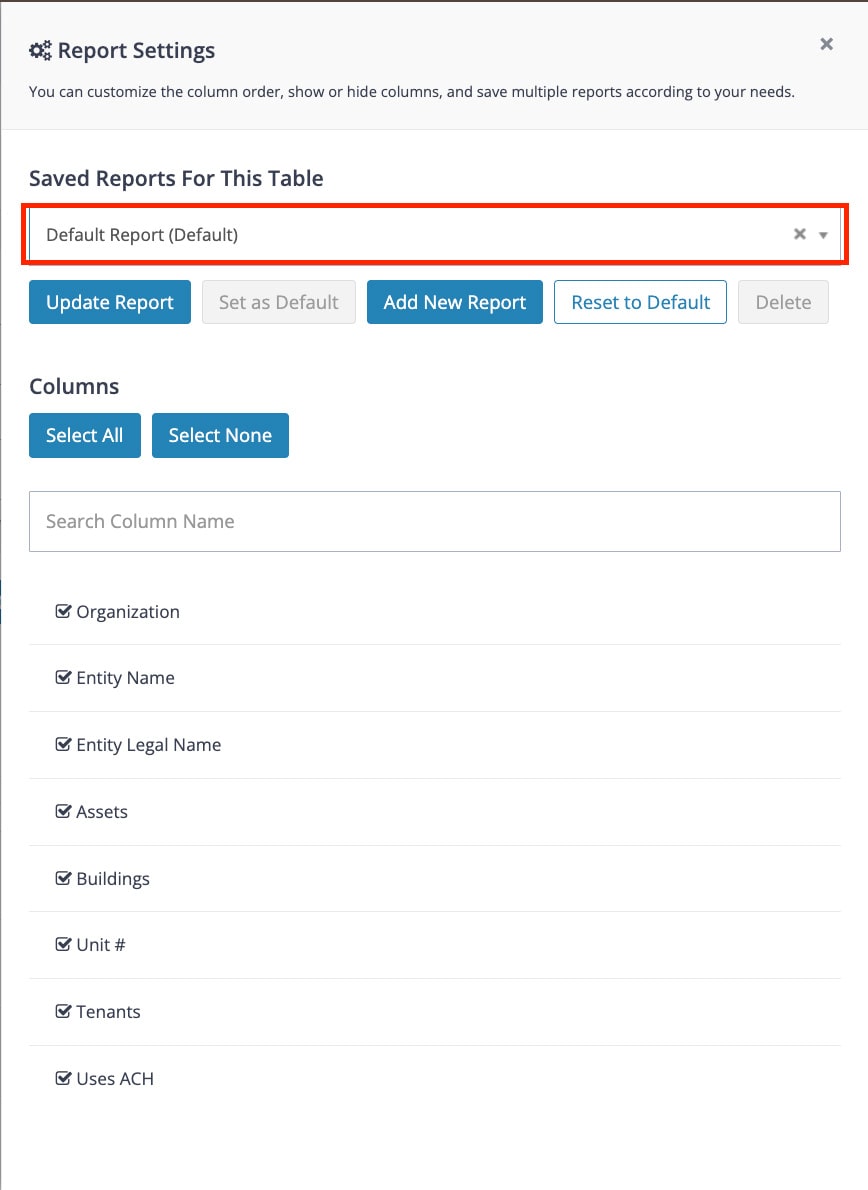
If you create multiple reports, you can manage them through the Report Profiles drop-down:
- To switch profiles, simply select from the drop-down.
- To change the default, highlight a profile and select Set as Default.
- To delete, select the profile and choose Delete.
These profiles make it easy to save report views so you don’t need to reconfigure columns every time you log in.
Exporting Your Data
Once you’ve customized your report, exporting it is simple.
- Navigate to the Excel button (or select the arrow for CSV or PDF) to export the table in its current condition.
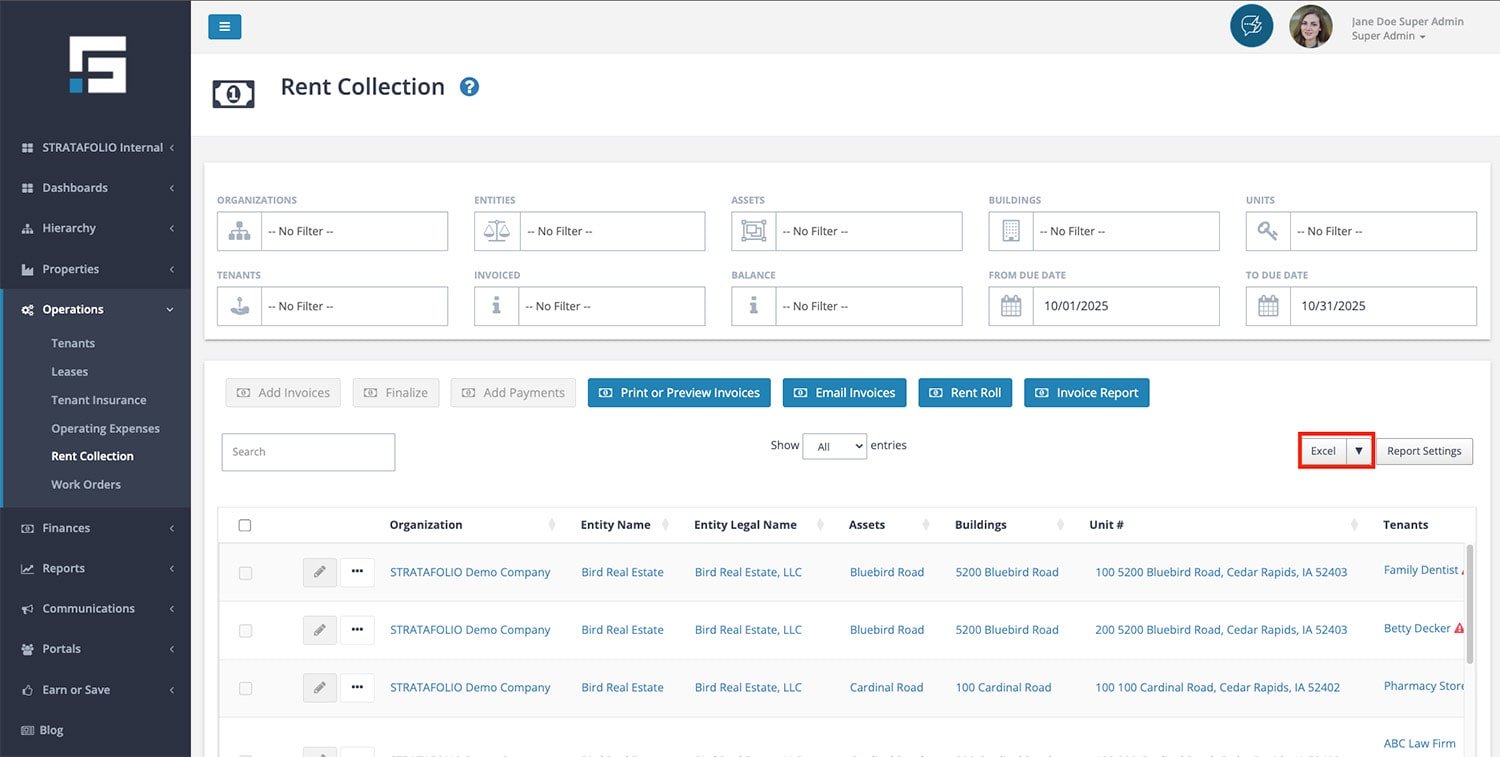
- The exported file reflects your current column order, and selected profile.
- The exported file does not reflect your current dropdown filters.
This ensures reports you share externally match exactly what you have set up in STRATAFOLIO.
Why Customized Reporting Helps
When creating multiple reports for different groups, customizing views saves time and effort. For example:
- A report for a financial institution may include original loan balance, current loan balances, interest rate, debt service coverage, or loan details.
- A report for a property manager may instead focus on lease expirations, operating expenses, and CAM reconciliations.
By saving different reports, you can switch between use cases instantly. Each time you run the report, STRATAFOLIO delivers it in the exact format you set up. This ability to customize financial or other standard reports improves efficiency, consistency, and accuracy across your team.
Export Reports to CSV or Excel
STRATAFOLIO makes reporting flexible by allowing you to export data from any table across the platform. Whether you want to analyze tenant payments, lease data, or financial performance, you can quickly download reports into Excel, CSV, or PDF.
Exporting Reports from Tables
Every section in STRATAFOLIO that displays data in a table has an Export button found in the upper-right corner of the screen. With one click, you can export the information into Excel, CSV, or PDF format. The exported file reflects the current table view, including active filters, column selections, and data order.
This means you can generate a customized report that looks exactly the way you want, then save or share it outside the platform.
Customizing Reports with Report Settings
Next to the Export button, you’ll see a Report Settings option. This feature lets you tailor how data appears in your tables before exporting.
Within Report Settings, you can:
- Show or hide columns using simple checkboxes.
- Save multiple report views for different purposes.
- Update, reset, or delete saved reports as needed.
- Set a default report view so your preferred layout loads every time.
This flexibility allows you to build reports that match the needs of different stakeholders. For example, you can save one report layout for your property managers and another for your financial team.
Every user of STRATAFOLIO can create their own custom reports.
Rearranging Columns
You can also change the order of data by dragging and dropping columns directly within the table. Just select the column header, move it to your desired position, and the table will update instantly. Then, you will need to save this view for the report you are on.
When you export your report, STRATAFOLIO preserves the column order, ensuring the downloaded file matches what you see on screen.
Static and Dynamic Reports
Beyond individual table exports, STRATAFOLIO provides you the ability to access Static Reports and Dynamic Reports from the Reports tab in the left-hand navigation panel.
- Static Reports give you predefined insights such as the Rent Roll, Operating Expense Report, and Invoice Report. These are ideal for presenting standardized data to lenders, other stakeholders, investors, or auditors.
- Dynamic Reports let you drill into detailed data for organizations, entities, assets, units, tenants, leases, and more. You can apply filters, adjust columns, and then export exactly what you need. There is no limit to the number of reports you can create!
This combination gives you both consistency and flexibility — standard reports for recurring needs and dynamic reports for deeper analysis.
Best Practices for Exporting
- Always confirm you’ve applied the right filters before exporting.
- Save customized report views you use often to save time in the future.
- Keep exported files in a secure location, especially if they contain sensitive tenant or financial data.
- Use Excel or CSV for further analysis, and PDF for sharing finalized reports externally.
Summary
With STRATAFOLIO, exporting reports is quick, flexible, and customizable. You can adjust table settings, rearrange data, save different report profiles, and access a wide range of static and dynamic reports. Whether you need a quick CSV export for analysis or a polished PDF report for investors, STRATAFOLIO provides the tools to get it done efficiently.