Overview
The Cash Flow Report is the side-by-side financial report that lives on the Owner Dashboard inside STRATAFOLIO. It is the most detailed view of your portfolio’s financial story on the dashboard. While the metric tiles give you a quick snapshot and the charts help you spot trends, the Cash Flow Report shows you the full picture, line by line.
The report walks you all the way down from your top-line operating income through every expense category, your debt service, and finally to your bottom-line cash flow. Because it can show two columns side by side, you can compare the numbers based on the preset time period in the date filters. This makes it easy to see what is growing, what is shrinking, and where your money is really going.
Like everything else on the Owner Dashboard, the Cash Flow Report is presented on a cash basis. This means each number reflects when money actually moved in or out of your accounts during the time period you selected.
Before You Begin
To get accurate numbers in the Cash Flow Report, take a few steps first.
- You have an active STRATAFOLIO account with permission to view the Owner Dashboard. Owners, administrators, and managers can see this report.
- Your QuickBooks integration is connected and syncing. The Cash Flow Report pulls every line item from your accounting data. If your sync is broken or behind, your numbers may be inaccurate or out of date.
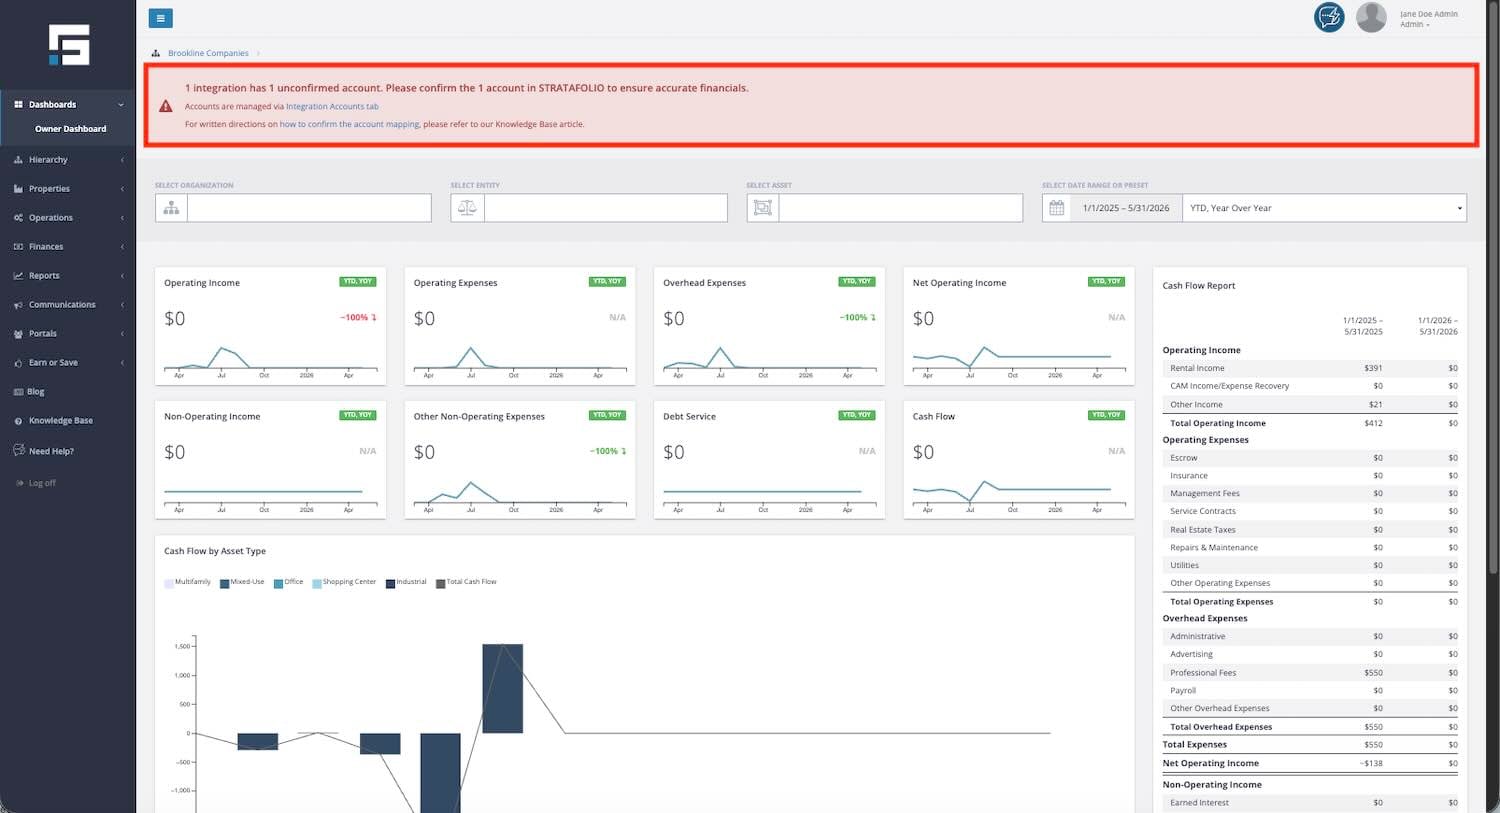
- All accounts in your chart of accounts are confirmed and mapped. This determines whether an expense appears under Operating Expenses, Overhead Expenses, or Other Non-Operating Expenses. If the red banner at the top of the Owner Dashboard indicates that accounts are unconfirmed, click the Integration Accounts tab link to confirm them. Until you do, line items may be missing or grouped under the wrong category.
- Your QuickBooks file is set to Cash Basis when you compare STRATAFOLIO numbers to QuickBooks reports. STRATAFOLIO always shows amounts on a cash basis, so this keeps both systems in sync.
Where to Find The Cash Flow Report
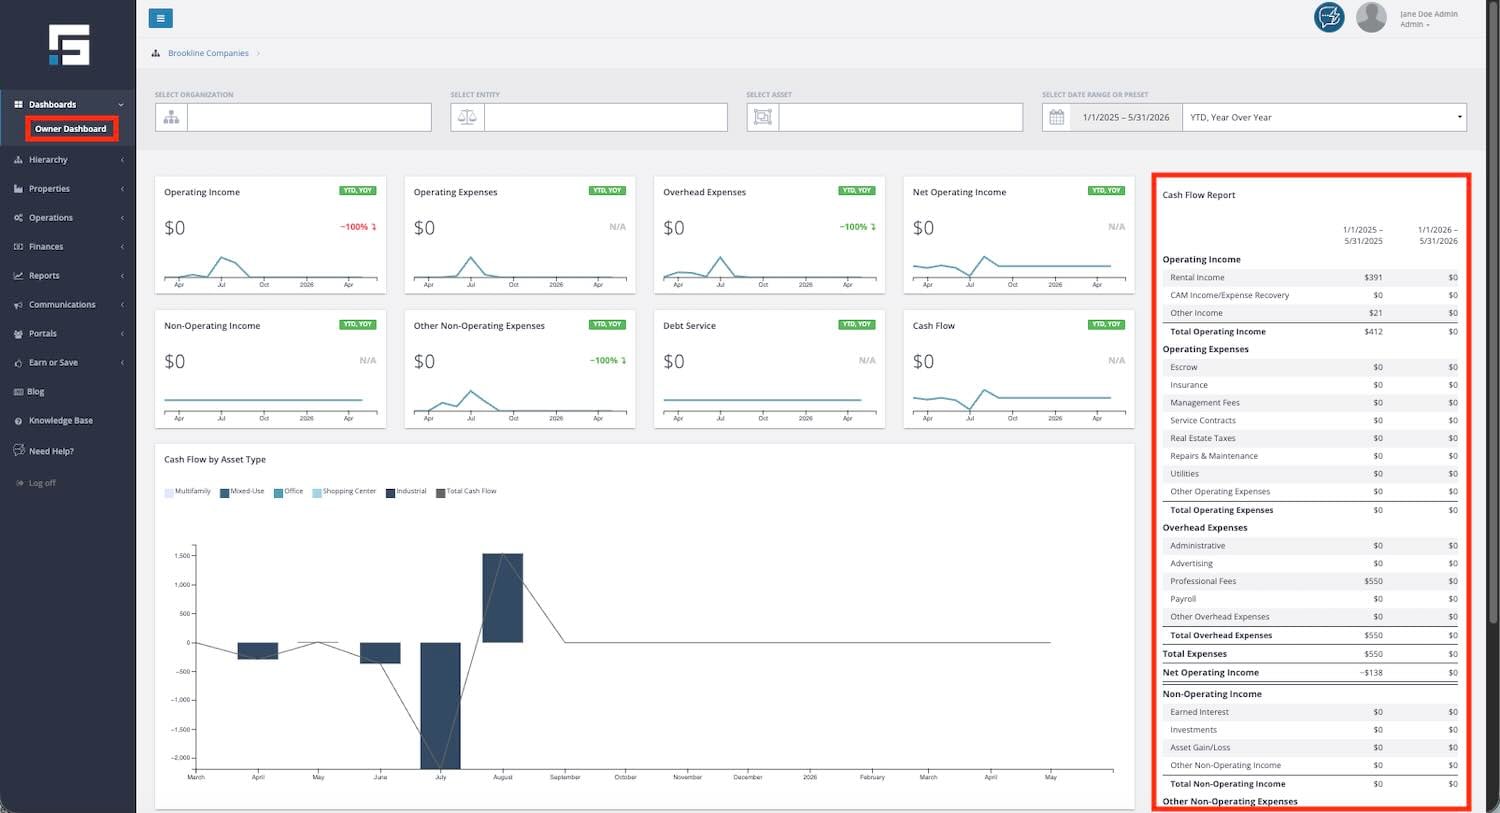
The Cash Flow Report is built right into the Owner Dashboard. Here is how to reach it.
From any page in STRATAFOLIO, look at the left side navigation menu. Click Dashboards to open the menu, then click Owner Dashboard. From here, you will be able to see the Cash Flow Report.
If you do not see the full report, scroll down the page or widen your browser window. The report has many line items and may extend below your first screen view. Or reduce your screen size to fit the entire dashboard in a single view.
How to Use The Cash Flow Report
The Cash Flow Report has a clear, top-down structure. Here is how to read it in the order it appears on the page.
Step 1: Set Your Filters at the Top of the Dashboard
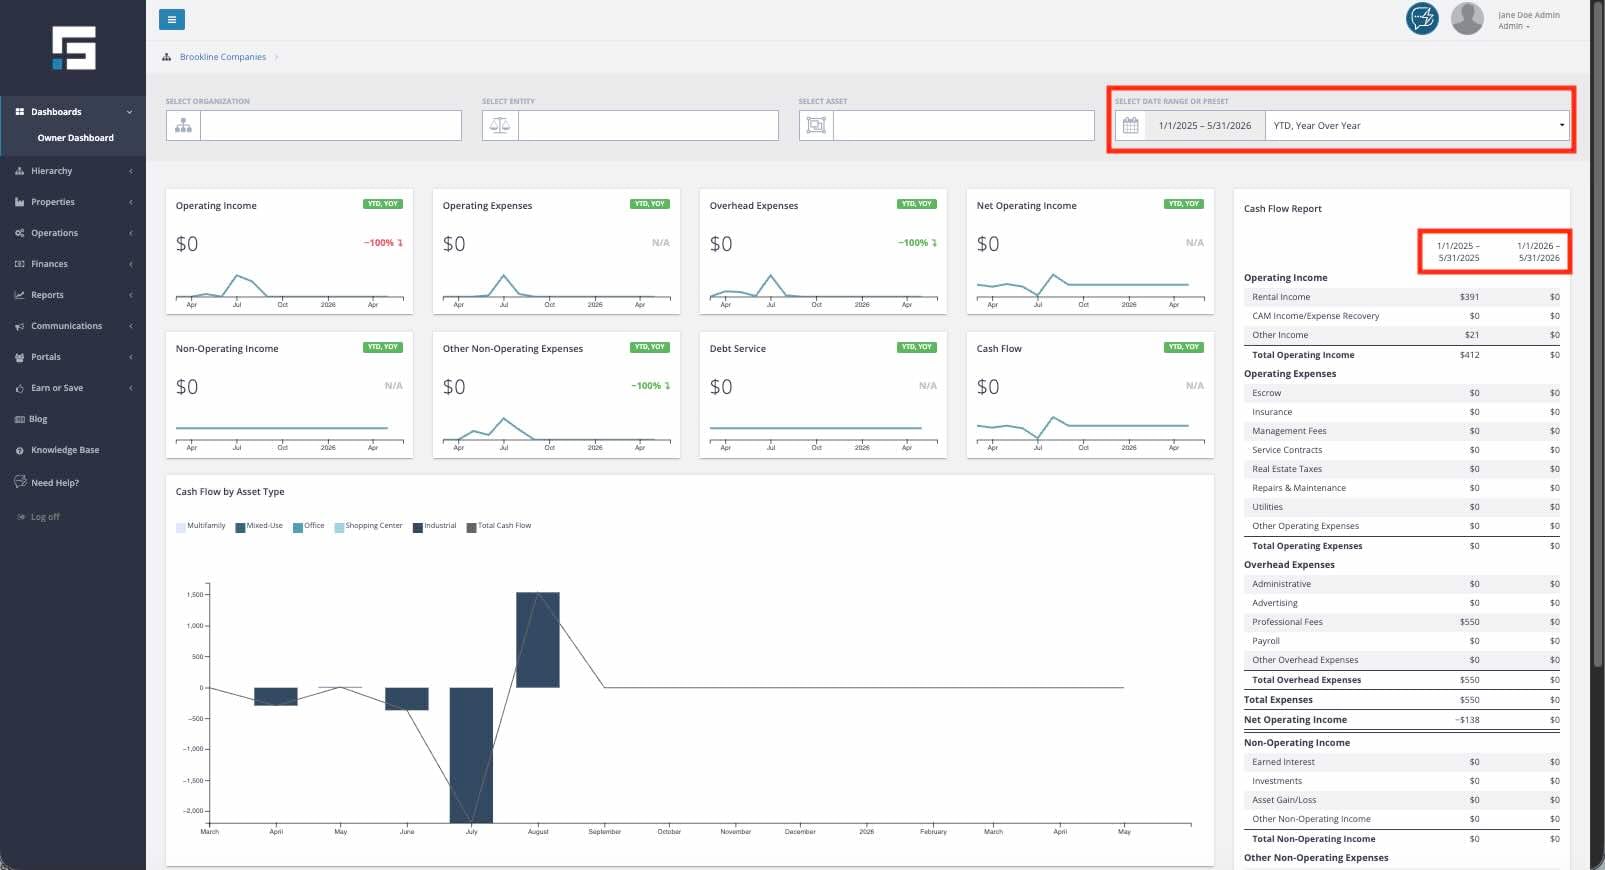
The filters at the top of the Owner Dashboard control what shows up in the Cash Flow Report.
Organization: Choose the organization you want to view.
Entity: Pick a specific legal entity, such as an LLC, or leave it blank to see the whole organization.
Asset: Pick a single property, or leave it blank to view all assets.
Date Range or Preset: Choose a preset like YTD, Year Over Year, to compare this year so far against the same months last year. You can also pick a custom date range.
NOTE: The time periods that can be compared are presets and cannot be customized. If you select a custom date range, the report will become a one-column report of the dates that you choose.
When you change any filter, the Cash Flow Report updates right away. In the case that it might take a while to load, wait for a few moments, and if it still does not work, refresh the page and apply the filters again. The two-column headers at the top of the report will show you exactly which time periods you are comparing (if you have selected a preset) or one column based on the custom date range you have selected.
Step 2: Read the Report from Top to Bottom
The Cash Flow Report is laid out in the same order that is typical of a P&L report and a Cash Flow Statement. Each section builds on the previous one, and the bottom line at the end shows your total cash flow for the period.
The report flows in this order:
Operating Income, including Rental Income, CAM Income or Expense Recovery, and Other Income, with a Total Operating Income line.
Operating Expenses, including Escrow, Insurance, Management Fees, Service Contracts, Real Estate Taxes, Repairs and Maintenance, Utilities, and Other Operating Expenses, with a Total Operating Expenses line.
Overhead Expenses, including Administrative, Advertising, Professional Fees, Payroll, and Other Overhead Expenses, with a Total Overhead Expenses line.
Total Expenses, which include Operating Expenses and Overhead Expenses.
Net Operating Income is calculated by subtracting Total Expenses from Total Operating Income.
Non Operating Income, including Earned Interest, Investments, Asset Gain or Loss, and Other Non Operating Income, with a Total Non Operating Income line.
Other Non Operating Expenses, including Capital Expenditures, Depreciation Expense, Amortization Expense, and Misc Non Operating Expenses, with a Total Other Non Operating Expenses line.
Debt Service, including Principal, Interest, and Loan Fees, with a Total Debt Service line.
Cash Flow is the final bottom line of the period you have selected.
Step 3: Get Insights from Comparing Different Time Periods
If you have selected a preset for the date filters, each line in the report shows you two numbers, one for each time period in the column headers. This is the side-by-side comparison that makes the Cash Flow Report so useful.
For example, if your filter is set to YTD, Year Over Year, and today is partway through the year, the right column will show year-to-date for this year, and the left column will show the same date range from last year. You can scan down the report and quickly see which line items grew, shrank, or stayed flat.
A few useful comparisons to make:
- Did Rental Income go up or down year over year?
- Are Operating Expenses growing faster than income?
- Did a specific expense category, like Repairs and Maintenance, jump compared to last year?
- How did Net Operating Income change?
- How did your final Cash Flow compare to the same period last year?
More Information on the Cash Flow Report
A few extra details will help you get the most out of the Cash Flow Report.
The Report is View-Only
You cannot click into a line item to edit numbers or open a transaction list. The report is designed to give you a clean, real-time snapshot of your portfolio’s financial story. If you need to change a number, the change must happen in your accounting system, and the Cash Flow Report will update the next time STRATAFOLIO syncs.
Take a Screenshot to Share
Since the report cannot be exported as a file, take a screenshot of the current view to share it with partners, investors, or your accountant. The screenshot will capture both columns and the filter context, as long as they are visible with your current screen settings.
The Report is Always on a Cash Basis
Every line item shows when money actually moved, not when it was billed or invoiced. If you compare the Cash Flow Report to a QuickBooks report, switch the QuickBooks report to Cash Basis so the numbers match.
The Report Respects Your Filters
If you filter to a single entity or asset, the entire report will show only that entity’s or asset’s numbers. This is helpful for entity-by-entity reviews or asset-by-asset reports.
Sync timing affects the numbers. QuickBooks Online syncs run automatically and usually finish within minutes. QuickBooks Desktop requires you to run the Web Connector. If a sync has not happened recently, your most recent transactions may not appear in the report yet.
Examples, Best Practices, and Tips When Using the Cash Flow Report
Here are some practical ways owners and managers use the Cash Flow Report.
Monthly Performance Review
At the start of each month, open the Cash Flow Report with the YTD, Year Over Year preset to see how this year is tracking against last year. Look at Net Operating Income first, then scan down to Cash Flow.
Investor and Partner Updates
Filter the dashboard to a single entity, take a screenshot of the Cash Flow Report, and use it as a financial summary for your next investor or partner update. The side-by-side columns make the change in performance obvious.
Spotting Expense Creep
Walk through the Operating Expenses and Overhead Expenses sections, line by line. Compare each line to last year. If a category is growing faster than the rest, it may be worth investigating.
Loan Impact Check
The Debt Service section shows you exactly how much your loan payments are pulling out of cash flow each period. If Cash Flow at the bottom is negative, the Debt Service section is often a useful place to start asking questions.
Asset by Asset Comparison
Run the report for one asset at a time using the asset filter. Take a screenshot of each, then compare them side by side. This is a great way to see which buildings are pulling their weight.
Plan around big one-time items. Capital Expenditures, Depreciation, and Amortization all live in the Other Non-Operating Expenses section. If a property had a major renovation, you would see the impact here without it skewing your Operating Expenses.
Pair with the Cash Flow by Asset Type Graph
The chart shows you the monthly trend across asset types. The Cash Flow Report shows you exactly which line items drove that trend. Use them together for a complete story.
Troubleshooting the Cash Flow Report
If the Cash Flow Report does not look right, walk through these checks.
- Numbers do not match QuickBooks: Make sure you are running the QuickBooks report on Cash Basis. STRATAFOLIO always uses a cash basis for this report. If you compare it to an accrual report in QuickBooks, the numbers may not match.
- Line items are missing or showing zero when you expect numbers: Check the red banner at the top of the dashboard for unconfirmed accounts. Unmapped accounts will appear in the report, but not in the right location. Follow the Integration Accounts tab link and confirm them.
- A category looks too high or too low: Check that your chart of accounts is mapped to the right STRATAFOLIO category. For example, if a professional fee is mapped as an operating expense in your accounting system, it may appear in the wrong section of the report.
- The comparison column shows mostly zeros: The entity or asset you filtered to may not have had activity in the prior period. Widen your date range or clear your filters to see more.
- Recent transactions are not showing up: Check your sync. QuickBooks Online usually syncs within minutes. QuickBooks Desktop requires you to run the Web Connector. Run a sync and refresh the dashboard.
- The report does not match what you expected to see: Confirm the time period in the column headers. If the filter is set to YTD (Year Over Year), the columns will show only year-to-date data, not full-year totals.