Numbers drive real estate investment decisions. The question is, which metrics matter? In today’s blog, we dive deep into the metrics that matter most to real estate investors, so that when it comes time to report to them, you’re fully prepared!
Metrics that Matter Most
New real estate investors often become confused with the countless methods to evaluate an investment as well as the industry acronyms. Depending on the investment goals and property type, some metrics carry more weight than others. When analyzing the accounting for real estate to make investment decisions, investors typically use the following metrics:
Capitalization Rates (Cap Rate)
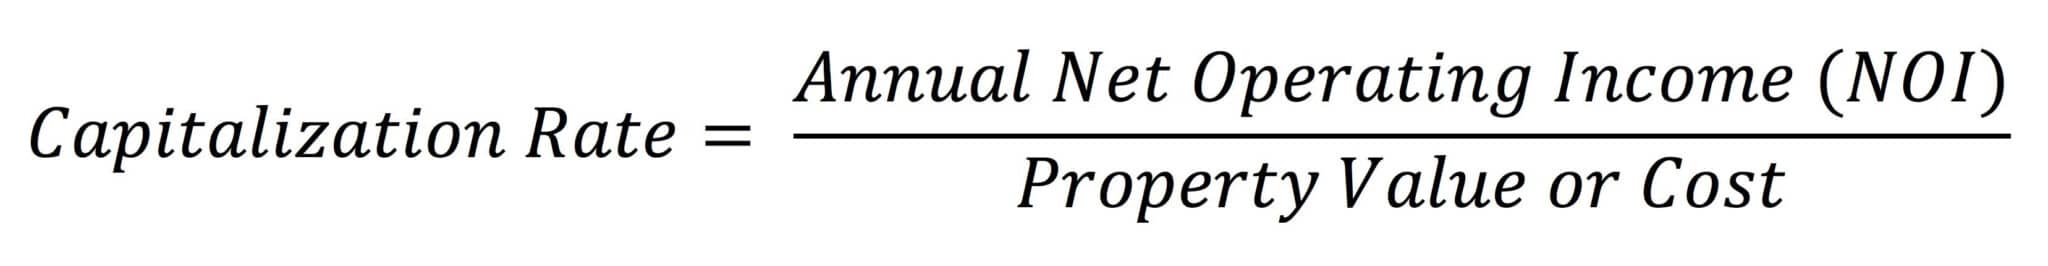
Talking about real estate investing without capitalization rates is next to impossible. Referred to as cap rates, these estimate the investors’ potential returns on a property. Use cap rates to compare similar properties in different markets.
Cap rate is calculated by dividing annual net operating income by the cost of the asset (or its current value). As cap rates go up, the return on your investment goes down.
Check out our webinar about the Importance Of Your Cap Rate.
Internal Rate of Return (IRR)
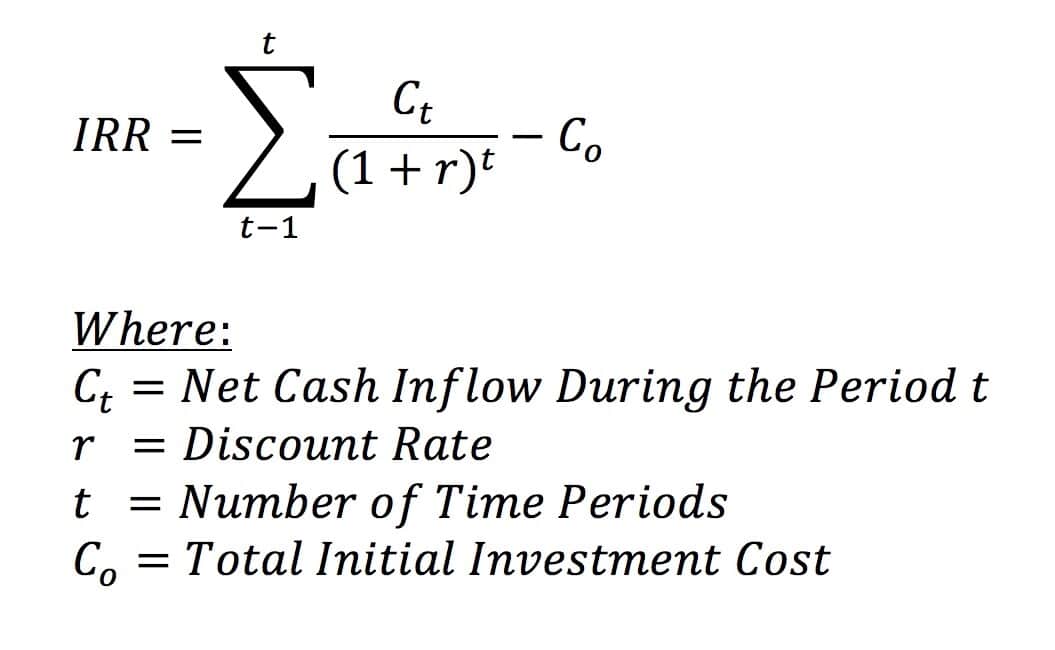
Investors use IRR to measure a project’s profitability. This metric accounts for initial investment costs, cash flow, and property sale proceeds. The higher the IRR, the more attractive the project.
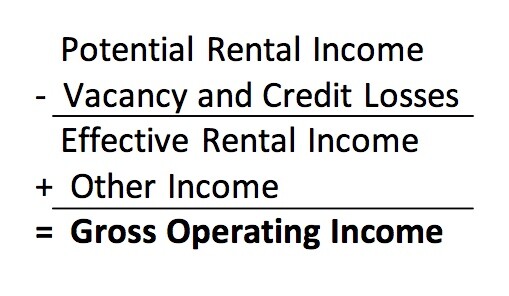
Gross Operating Income (GOI)
How much capital will it take to run a property? For this, investors rely on gross operating income (GOI). The figure removes the estimated losses in tenant vacancies or credits from the potential operating income.
Net Operating Income (NOI)
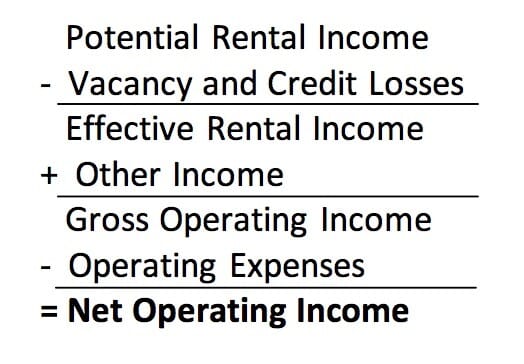
Abbreviated as NOI, this metric explains how much money the property will earn after all operating expenses are paid. Essentially, NOI is the total income minus expenses. Income includes income from rent, parking, and other monthly fees assessed to clients. Expenses include vacancy and credit losses, property taxes, insurance, management fees (if they apply), utilities, maintenance type expenses, and management type expenses (legal, accounting, etc.). NOI does not include costs which are unique to each investor such as a mortgage.
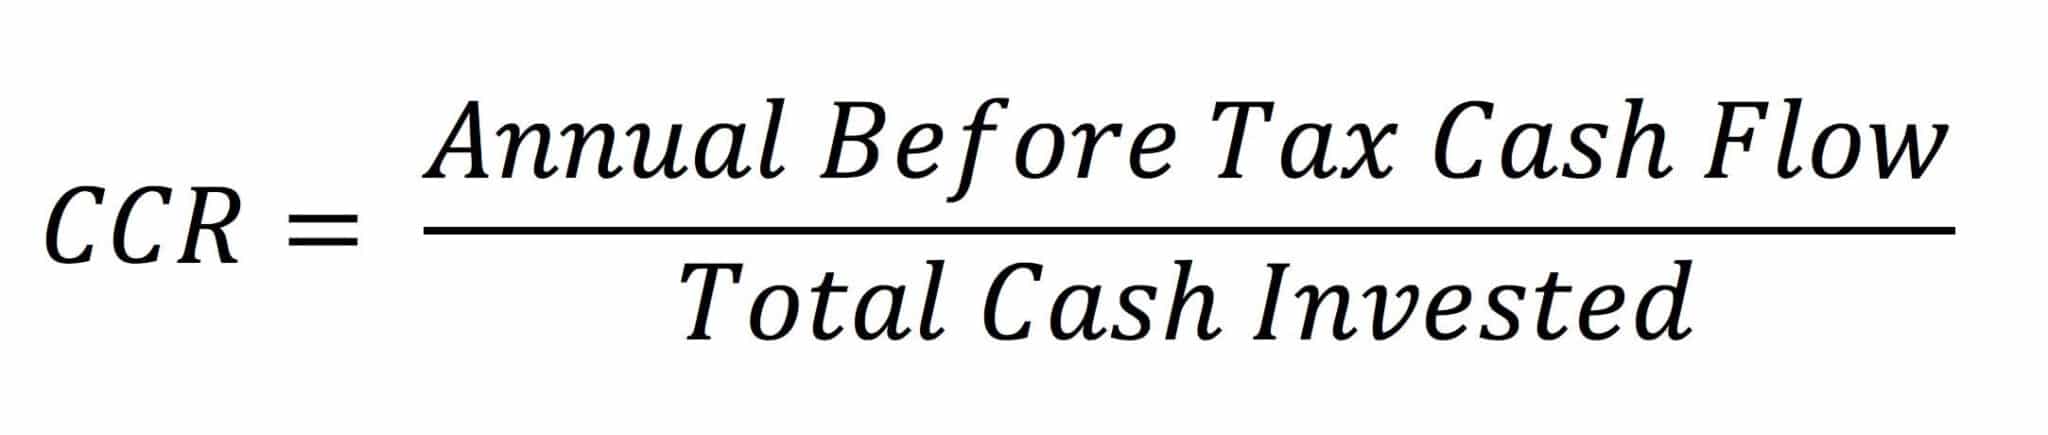
Cash-on-Cash Return (CCR)
Cash-on-cash, or cash yield, is a common metric in the commercial real estate industry. The rate of return measures the annual pre-tax cash flow divided by the total cash invested. This figure measures the investment’s performance.
Consider this example. Investor Mark B is looking at two multi-family properties. He has $250,000 available for a down payment and will finance the remainder. Property A has an estimated pre-tax cash flow of $60,000 and Property B estimates a pre-tax cash flow of $75,000. Using the formula, this means Property A has a 24% estimated return while property B has a 30% estimated return. All else being equal, property B is the better investment.
However, the cash-on-cash return does not factor in other investment considerations.
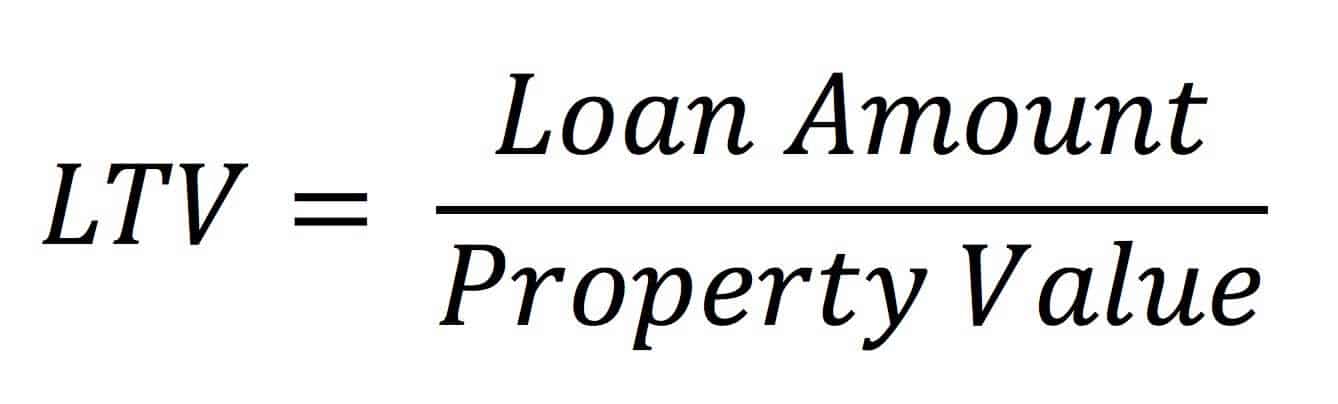
Loan-to-Value Ratio (LTV)
Lenders and financial institutions use loan-to-value (LTV) to assess risk. The higher the LTV, the more risk involved with the loan. A higher LTV could add additional costs to the investment, either through interest rates or requirements to purchase additional insurance. While the required LTV ratio can vary between lenders and by types of loans, generally the accepted LTV ratio is between 65-80% (see our article on Getting a Commercial Real Estate Loan for more information)
For example, if Susie is seeking a traditional mortgage to purchase a shopping center worth $500,000, but she only has $50,000 for a down payment, her LTV ratio is 90%. Her lender may require an 85% LTV. In this scenario, Susie would need to come up with another $25,000 before qualifying for the mortgage.
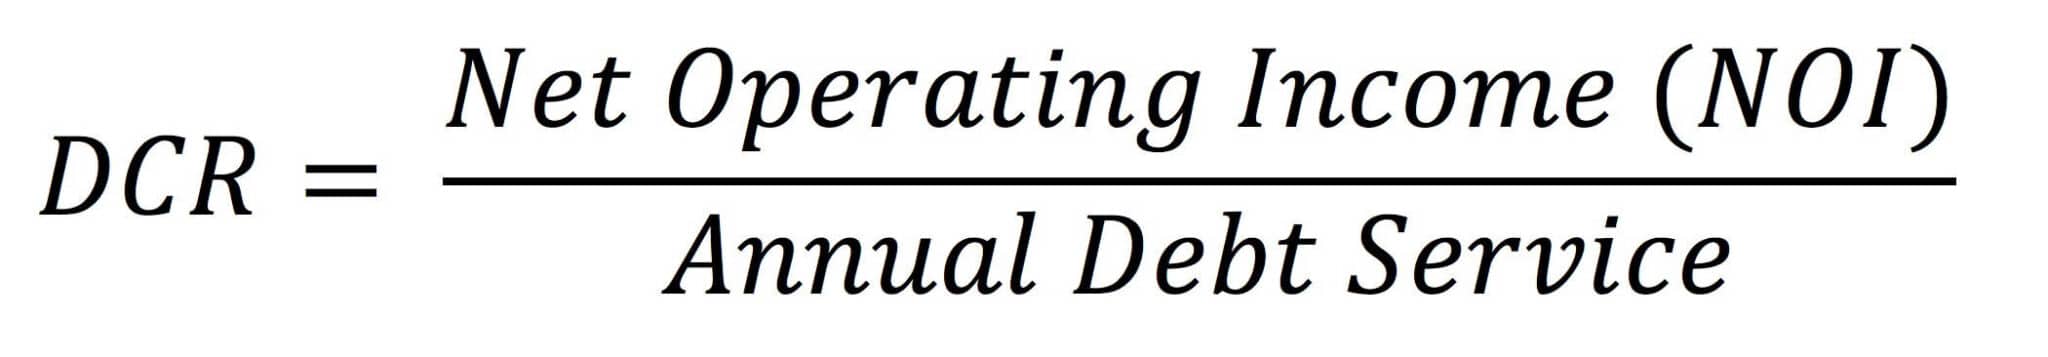
Debt Coverage Ratio (DCR)
Another name for this ratio is debt service coverage ratio (DSCR). This formula is calculated by taking the annual NOI and dividing it by the total debt service. A DSCR of less than 1 expresses negative cash flow or not enough cash to cover the mortgage payment. Requirements vary by institution, but most banks require a DSCR between 1.20 and 1.40.
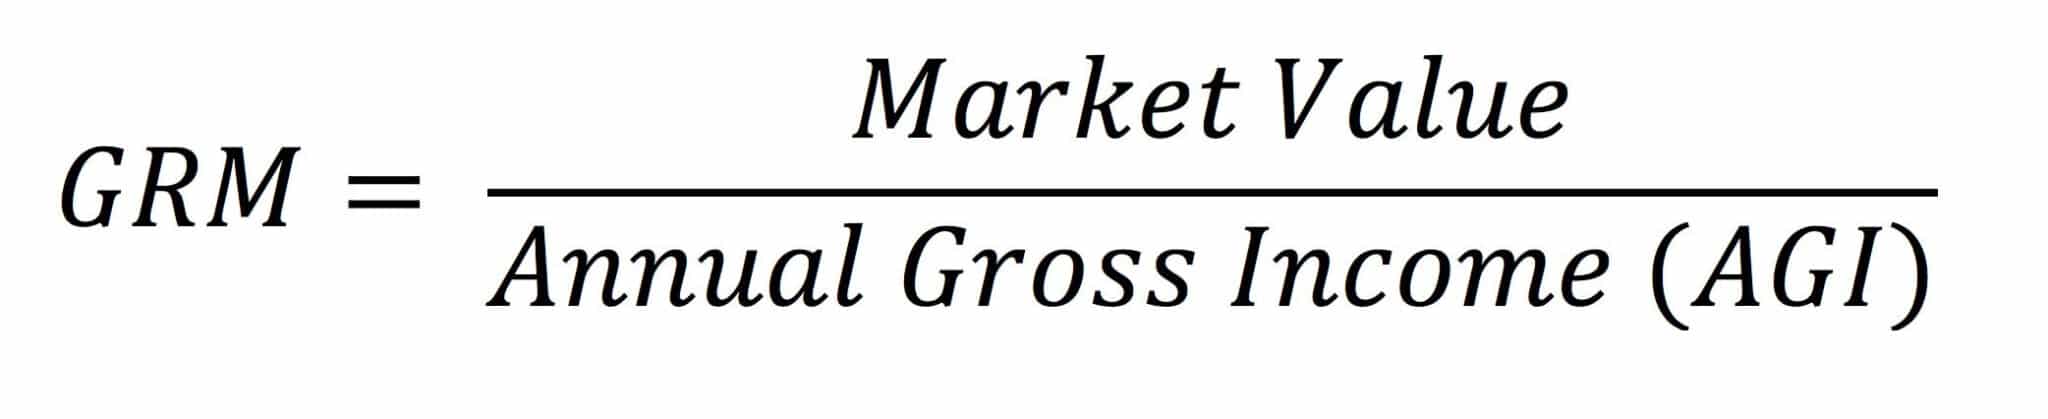
Gross Rent Multiplier (GRM)
For real estate investors seeking an easy assessment tool to compare properties, the gross rent multiplier metric can help narrow down the best opportunities. To calculate this, divide the property’s price by its potential gross annual income. If a property is listed for $500,000 and carries an annual income of $100,000, then the GRM is 5. GRM works best when ranking similar properties in relatively close proximity. Note that it does not factor operating expenses, market fluctuations, or loan amortization.
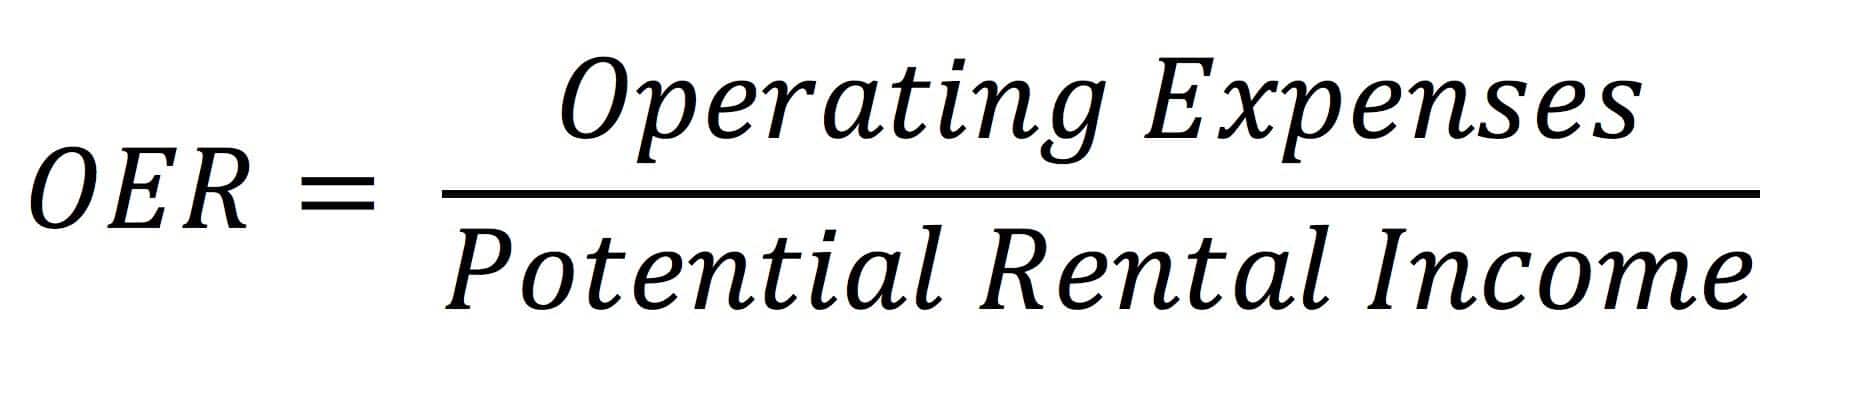
Operating Expense Ratio (OER)
Another question frequently asked is how much will a property cost you to operate. For this, calculate the operating expense ratio. Obviously, a property where expenses exceed income is a red flag. Here is how you calculate the OER. First, you add all the day-to-day operating expenses–insurance, landscaping, maintenance, utilities, taxes, management fees, et al.–but not any mortgage repayments or capital improvements. Then, divide the total operating expenses by your potential rental income. Essentially, the lower the OER, the more profitable the property.
Metrics Matter
Finally, tracking and comparing relevant metrics will help improve your overall performance. For instance, when following an OER over time, you may notice a negative trend where the expenses are increasing. And, the investigation into why the property is underperforming may lead to a decision to sell the property. Additionally, the IRR metric provides clues if a development is a good bet or sends a warning signal to stay clear of the deal.
In summary, depending on the property type and goals, other metrics may be beneficial to you. However, you choose to understand an asset’s performance, make sure to thoroughly understand what the metric measures and how it is computed. If you’re a residential real estate investor, check out this helpful guide to metrics we’ve found. If you have commercial real estate and have outside investors, then you should check out STRATAFOLIO and how we help track investors in your real estate portfolio.