The field of real estate accounting is all about keeping track of, studying, and reporting on the money that comes in and out of real estate businesses. Real estate companies of all sizes, from small property management firms to large real estate investment trusts, must spend time analyzing financial reports.
As a commercial property owner, keeping track of your finances can be challenging, particularly as your portfolio expands and you acquire additional properties. It can be time-consuming to track every expense, rent, and maintenance cost (for starters!). STRATAFOLIO offers a solution to simplify accounting and reporting management, which we will review in more detail as we explore our Cash Flow Dashboard.
How can STRATAFOLIO help?
Accurate real estate accounting ensures compliance with regulatory standards, helps in strategic planning, and enables effective cash flow management.
Cash Flow Dashboard
Analyzing cash flow across multiple commercial real estate companies typically requires manually exporting, massaging, and combining data from multiple spreadsheets. At least that’s what we’ve seen our customers do before they discovered STRATAFOLIO.
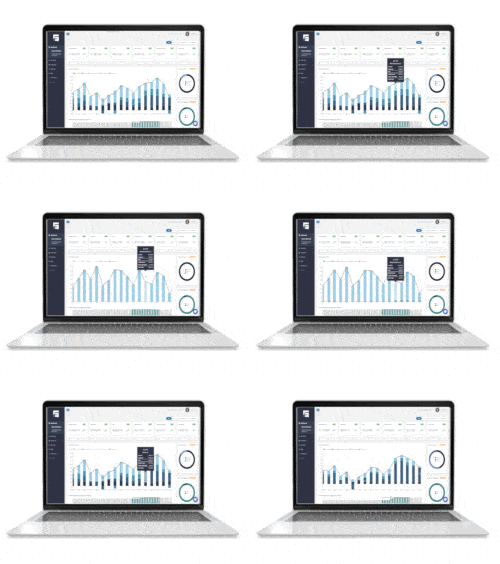
Our Cash Flow Dashboard provides owners with a real-time global view of cash flow across their entire portfolio. Plus, the cash flow dashboard shows cash flow on a cash basis. With multiple filtering options, you can view a specific asset class or entity, along with the metrics that relate to it, as you drill down into it. You can also see:
- Operating Income
- Operating Expenses
- Overhead Expenses
- Net Operating Income
- Non-Operating Income
- Other Non-Operating Income
- Debt Service and
- Cash Flow
Housing this information in the cloud in STRATAFOLIO allows you to view this data in real-time, from anywhere. All you need is an internet connection.
STRATAFOLIO also offers a standardized Chart of Accounts for commercial real estate that we invite you to download for free. This helps owners clearly track overhead and reimbursable expenses in preparation for yearly Common Area Maintenance reconciliations.
Loan Dashboard
Another great dashboard in STRATAFOLIO is our Loan Dashboard, which allows you to see debt-specific metrics that are critical to the success of any commercial real estate company. Most products on the market now are focused on property managers. STRATAFOLIO is designed for commercial real estate owners because we know the data you need to have at your fingertips.
In our Loan Dashboard, you can filter by Lender, Entity, Asset, and additional Asset filtering options. Furthermore, you will see:
- Total Asset Value
- Total Debt
- Total Equity
- Average LTC
- Average LTV
- Average DCR, plus a metric of total outstanding loans, maturing loans, and so much more.
You can send the details of your Loan Dashboard to anyone in just a few clicks! Export the data at the bottom of the page via CSV, Excel, or PDF, and send it off via email. This data is commonly used for debt summary reports that are often requested by lenders. You can gather the data in seconds and send the report right away, instead of keeping them waiting for weeks!
STRATAFOLIO Reports
There are a number of reports you can generate in STRATAFOLIO. Three reports can be generated from the Reports tab, which include Rent Roll, Invoice Report, and Operating Expense Report.
- Rent Roll: Report to give to lenders, investors, or for you to understand your income, operating expenses, and occupancy by tenant, building, or globally. The rent roll report contains tenant and lease information, base rent, additional charges, rent escalations, operating expenses, and occupancy rate.
- Invoice Report: A report verifying all invoices generated for a particular period. The report contains all the invoices generated by the selected filters, containing the unit number, tenants, invoice number, finalized date, due date, and each line item in the invoice for a particular time period.
- Operating Expense Report: Report to understand which tenants do not have operating expenses for a particular period, or to verify the operating expense budget amounts per tenant or building. The report contains the tenant and unit information, lease terms, and operating expense information for the selected date range.
Every table within STRATAFOLIO pages can also be customized and saved as CSV, PDF, or Excel files, or printed. These include the tables at the bottom of the Organizations, Entities, Assets, Loans, Lenders, Tenant and Insurance pages, etc.
The possibilities of reports and real-time data at your fingertips are endless with STRATAFOLIO! In fact, given the number of combinations of views and properties, you can generate thousands of reports and save them right in STRATAFOLIO. You no longer have to dig through files and merge data in spreadsheets to get the reports your lenders or colleagues need.
QuickBooks Integration
STRATAFOLIO has a bi-directional integration with QuickBooks, meaning the information you put in QuickBooks will appear in STRATAFOLIO and vice versa. Eliminating the need for double entry also helps eliminate costly human errors between systems. Our connection with QuickBooks is another way we help to make managing your accounting and reporting easier. Contact us today for more information.


